Thibaut

Complete tutorial on fear & greed index (FGI)

The fear & greed index (FGI) is an indicator that gives the mindset of the crypto market. It is based on many parameters, some of them technicals, some of them socials. It gives insights on when to buy and when to sell.

What is the fear & greed index (FGI) ?

The fear and greed index is an indicator, whose values goes from 0 to 100. When the value goes closer to 0, the market is in fear status. When the values goes closer to 100, the market is in greed status. In other words, when the market is in fear, actors tend to sell their assets while being in FUD (Fear, Uncertainty, Doubt) ; When the market is in greed, actors tend to buy assets while being in FOMO (Fear of Missing Opportunity). You can find the source index here : https://alternative.me/crypto/fear-and-greed-index/
The idea here is to “buy the fear”, meaning that you buy the assets that actors are selling (because of too much loss), then sell them when everybody wants them. As a result, you buy when the price hits its lows, you sell when the price hits its highs. This is a kind of strategy that whales tend to use.
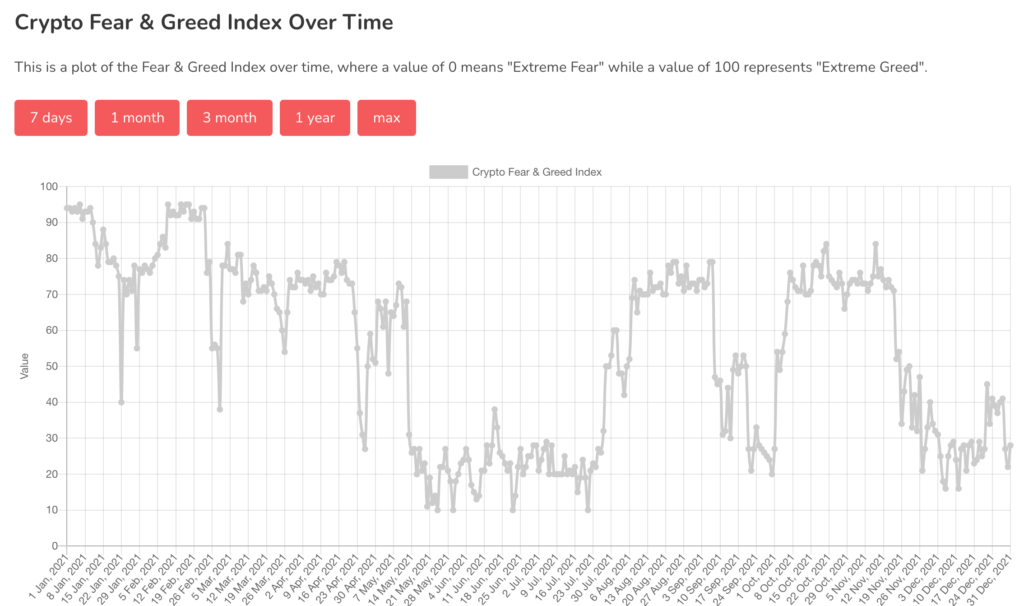
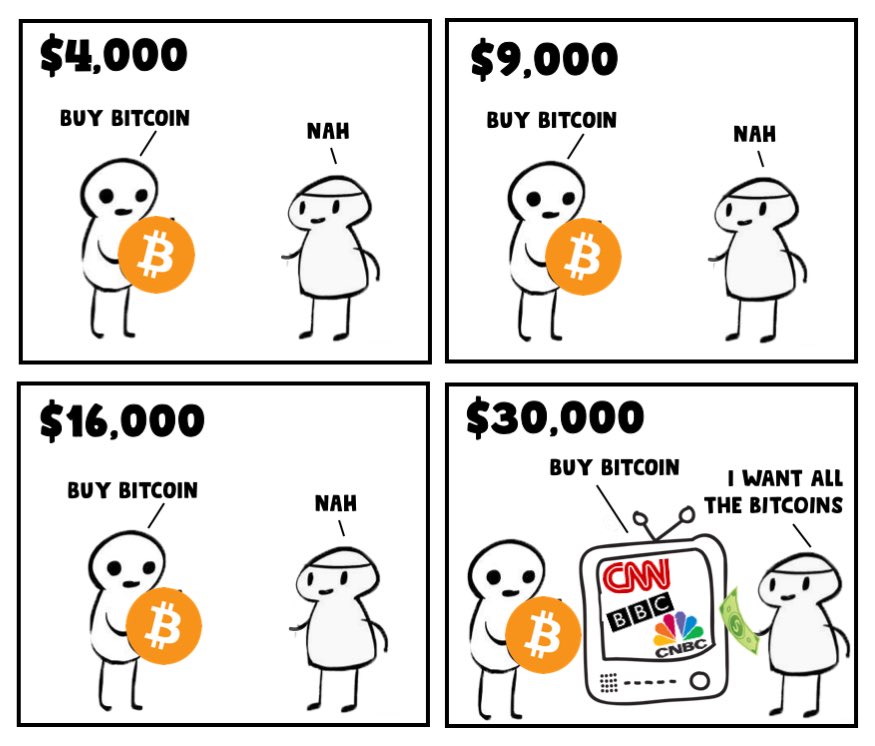
Evolution of FGI through 2021
FGI in one picture

How is the fear and greed index calculated ?

How to use the FGI ?

The FGI is to be used preferably on BTC but is still quite relevant on other cryptos as BTC is still the market leader. The strategy here is to buy when FGI is in extreme fear, and sell when FGI is in extreme greed. As the FGI is calculated everyday, it is advised to use a daily strategy. Here is a simple example:

  • If the FGI goes below 15, buy.
  • If the FGI goes above 80, sell.

Bot trading with FGI

Strategy example with FGI

The best part is that this demo strategy is available on the store on botcrypto. This means that you can now create a trading robot with this strategy!


Complete tutorial on fear & greed index (FGI) Read More »

Complete tutorial on volume

Volume is defined as the sum of the volumes traded over a given period. It is often indicated at the bottom of the graph.
It is useful for detecting declines in dynamics, which precede an explosive movement. Also, it is useful for establishing statistics as to the price.
A price traded at high volume indicates a great interest on the part of the actors, which reinforces the supports or resistances.
Also, the volume allows to show the activity of the Asian, European and American markets, in order to establish which session is the most influential, therefore the session which has the most volatility.

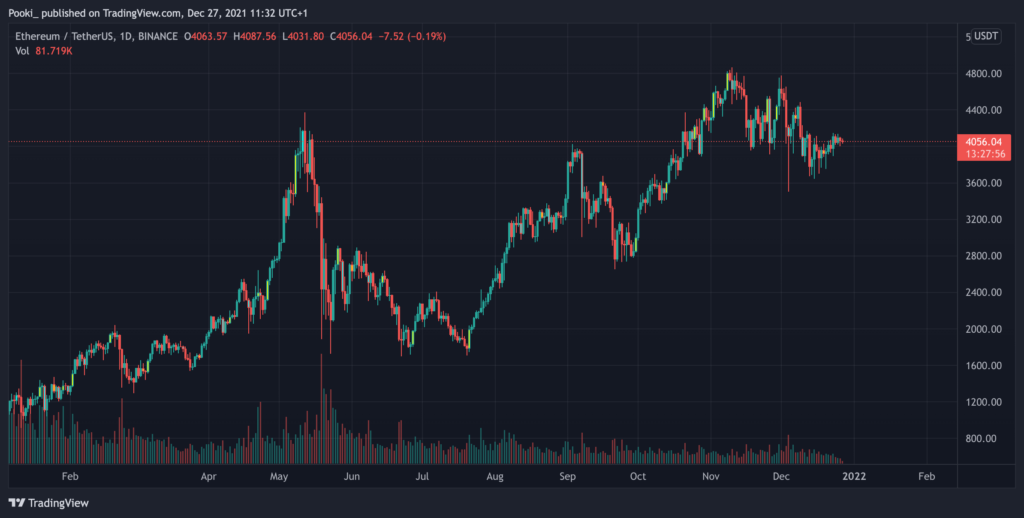
Here is an example of a daily volume on ETHUSDT, the volume gradually reduced, indicating a loss of interest and implying that an explosive move can happen at any time.

How to use volume ?

The main interest of volume is to detect periods of weak & strong activity, by relating the price. Although mainly used as a guide, you can establish a strategy based on the convergences of price versus volume in order to detect changes in direction.

  • If the volume of the last N candles decreases and the price also decreases, it is likely that a whale will cause a surprise pump. We must therefore position ourselves to purchase.
  • If the volume of the last N candles decreases and the price also increases, it is likely that the last buyers will place themselves. We must therefore position ourselves in the sale.

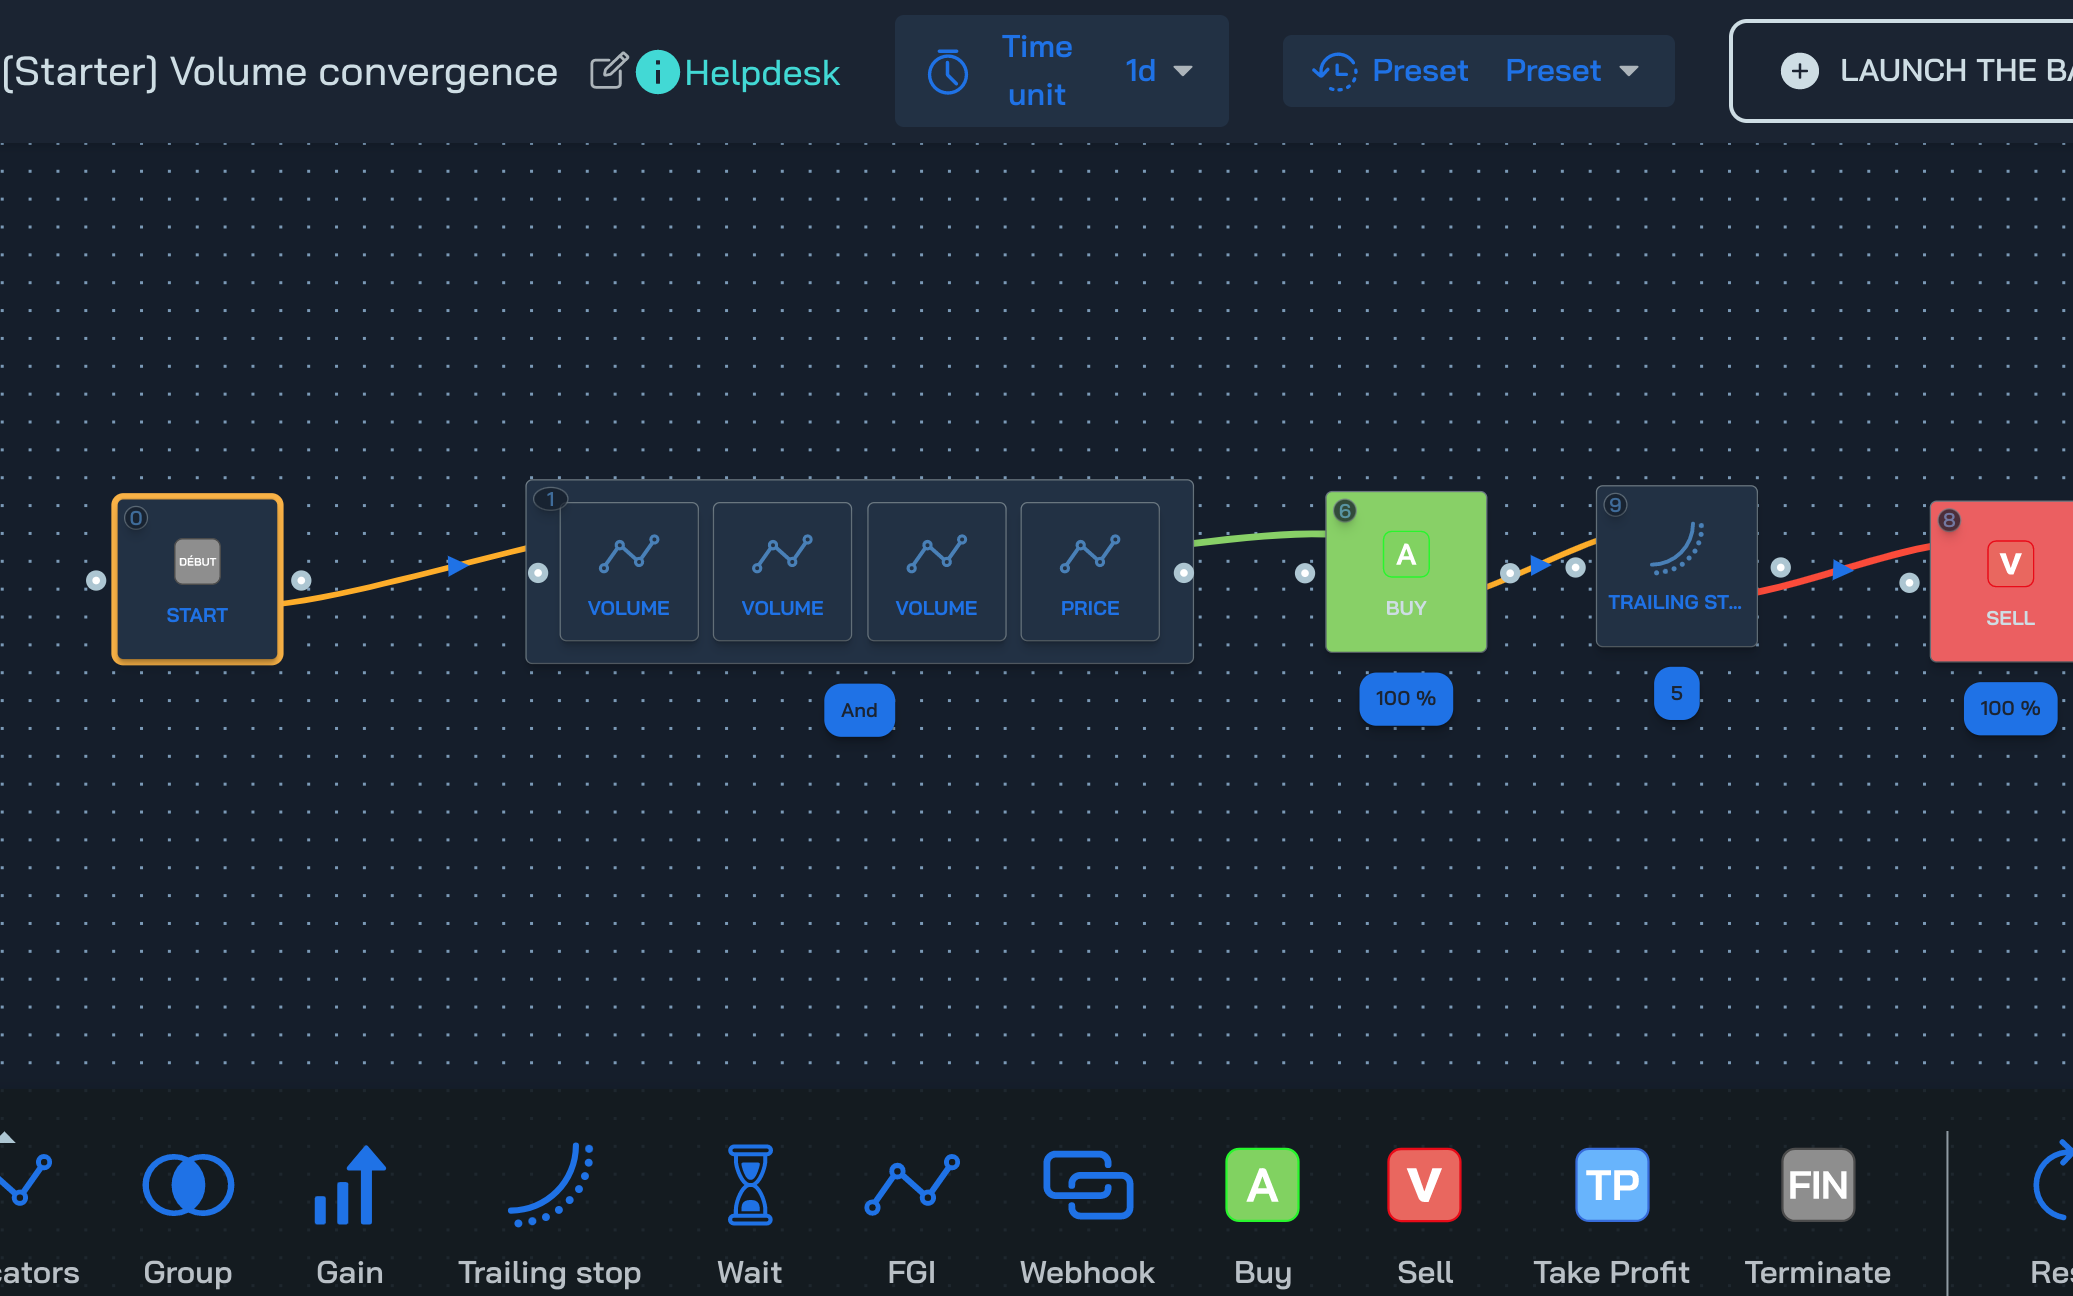
Trading bot with volume, price & convergence

3 conditions on the volume (a candle of smaller volume than the previous one) and a condition on the price (decreasing price) to trigger the purchase
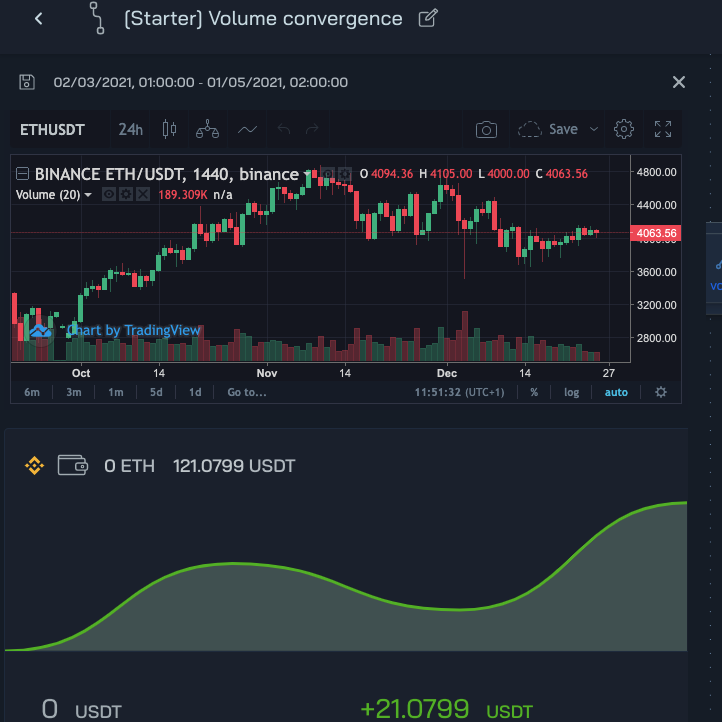
Test results

The best part is that this demo strategy is available on the store on botcrypto. This means that you can now create a trading robot with this strategy!


Complete tutorial on volume Read More »

Complete tutorial on pivot points

Pivot points are dynamic prices that define resistance and support relative to a benchmark price. It is easy to use which makes it a good technical indicator when starting out in technical analysis, because the “buy supports and sell resistances” method remains simple and effective. These points are mainly used on the stock market but work just as much on the crypto market.

What are the pivot points ?

Pivot points are dynamic prices that define resistance and support with respect to a reference price, noted point P). The resistances are noted R and the supports S. The closest resistance is R1 then the next one is R2 and so on until R5. The logic is the same for supports. The closer the price gets to a distant support or resistance, the more likely it is to change direction (so you have to take your profits).
The advantage of pivot points is that you have a guarantee of profit if you buy support and sell resistance. This is a significant advantage compared to moving averages.

  • If the price crosses R1 upward, the price is likely to rebound downward. If the price reaches R2, the probability of retracing is even higher.
  • If the price crosses S1 lower, the price is likely to rebound higher. If the price reaches S2, the probability of retracing is even higher.
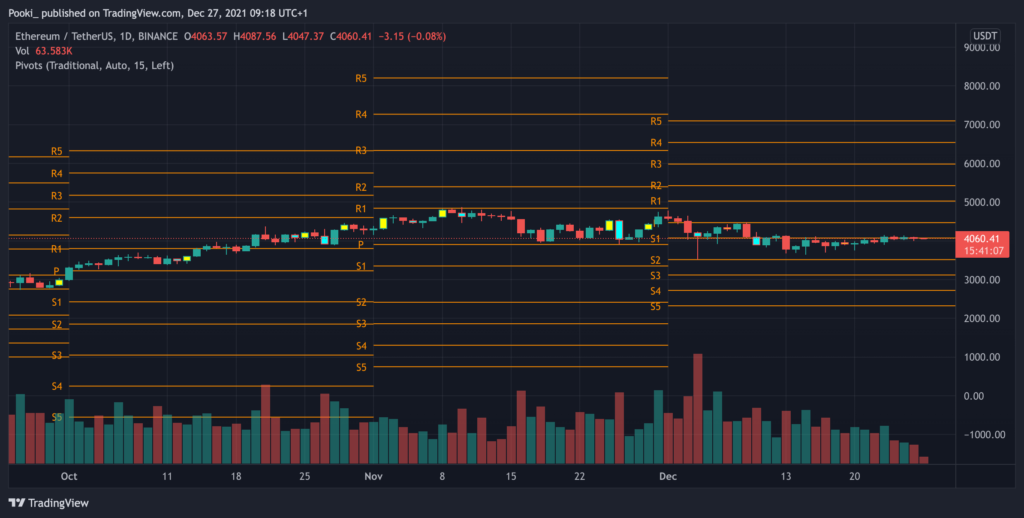
Here is an example of daily pivot points on ETHUSDT, recalculated every first of the month (basic configuration on Trading View)

Comment est-ce que les points pivots sont calculés ?

How to use the pivot points ?

The main purpose of points is to stagger one’s buying and selling according to the position of the price. You will find 2 strategies:

Strategy 1: Buy the S1, Sell the R1
The points S1 and R1 are most often reached but offer only limited benefits. It is a simple strategy, with limited risk and advantageous for scalping, the risk of which relates to the management of allocated funds.

  • If the price hits S1, buy with 100% funds.
  • If the price hits R1, sell 100% of the position.

Strategy 2: Stagger purchases and sales
This strategy consists of removing the risk from the management of funds by dividing the volume of buying and selling according to the level reached. It’s a bit more complex to set up but your entry points and average exit points are more optimized and your profits better. It is a more effective strategy when the price is more volatile.
NB: You can combine this strategy with momentum indicators to take advantage of times of high volatility.

  • If the price hits S1, buy with 50% of the funds. If the price hits S2, buy with 30% of the funds. If the price hits S3, buy with 20% of the funds.
  • If the price hits R1, sell the first trade. If the price reaches R2, sell the 2nd trade. If the price reaches R3, sell the 3rd trade
    NB: To limit the risk, I can add a condition asking to close all trades if the price goes from R2 to R1.

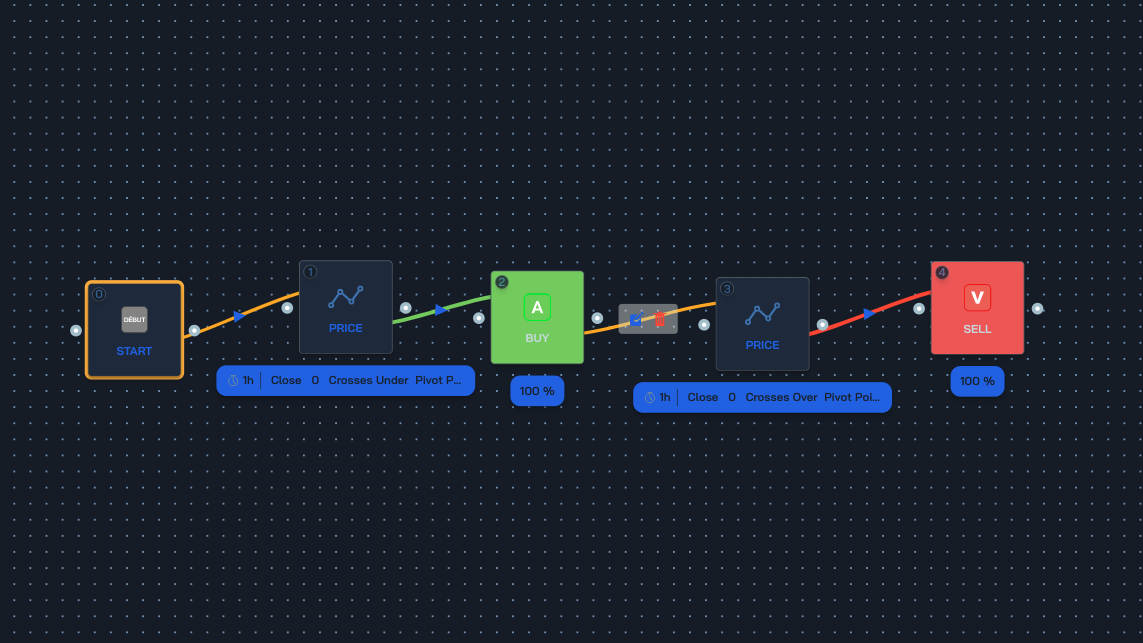
Bot trading with pivot points, 2 strategies

Strategie 1
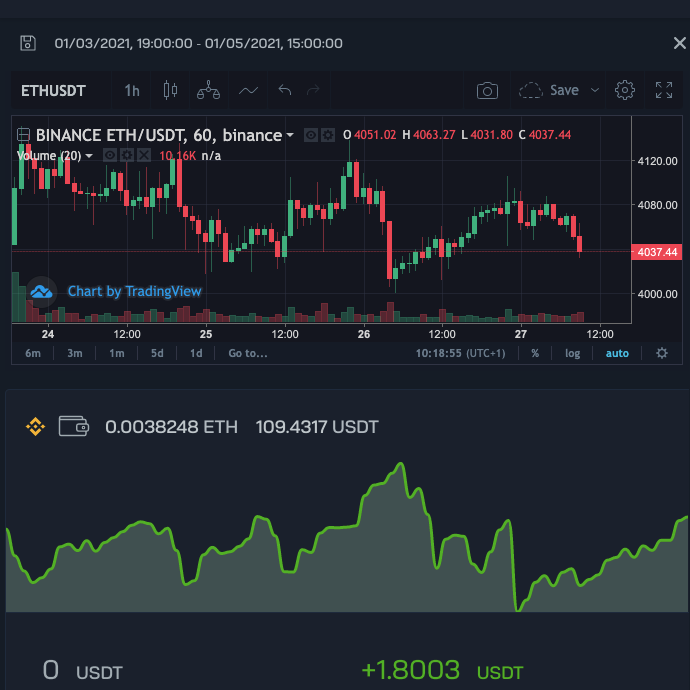
Strategie 1 results

The best part is that this demo strategy is available on the store on botcrypto. This means that you can now create a trading robot with this strategy!


Complete tutorial on pivot points Read More »

The complete tutorial on the Choppiness Index

The Choppiness Index (also called Chop index) is a reliable indicator for detecting trends & consolidation phases. It is easy to use which makes it a good technical indicator when you are a beginner in technical analysis. The Choppiness Index was created by Australian commodity trader E.W. Dreiss, based on the chaos theory (i.e. the price action is not related to any model and cannot be predicted). This is a useful indicator that helps you to allocate your funds at the right time.

What is the Chop Index ?

The Chop consists of one line that evoles in a defined range. When the Chop value is above the range, it means that the price finished its consolidation and the price will start a new trends, regardless of its direction (meaning that it can be an uptrend or a downtrend). When the Chop value is below the range, it means that the price finished its trend and will start its consolidation.

  • If the chop index value is above 62, the price is ready to start a trend.
  • If the chop index value is below 38, the price is ready to consolidate.

And the more extreme the value is, the sooner the price will enter into the phase. Think of it like an energy level of the price movement.

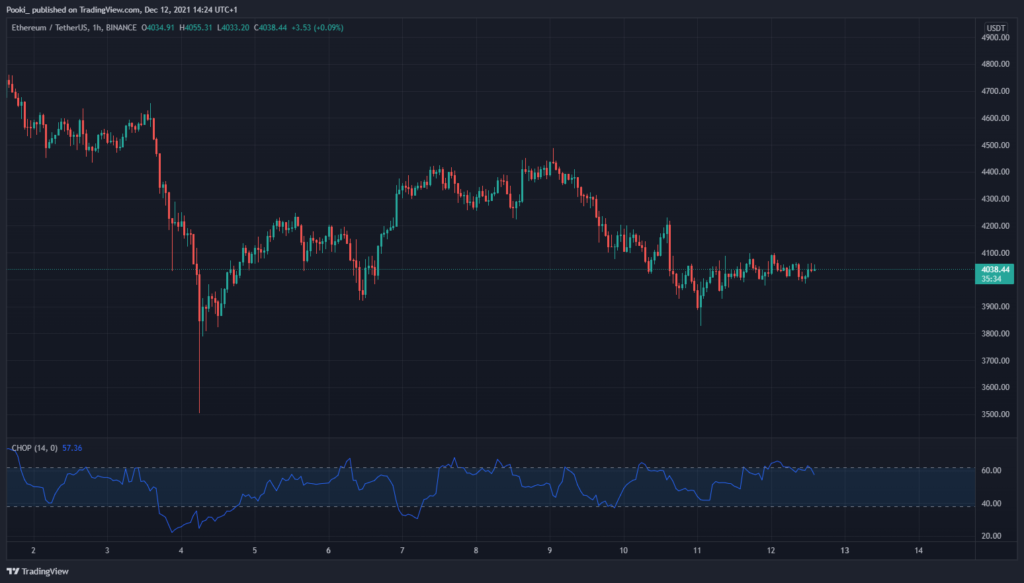
Here is what the chop index looks like.

How is the Chop Index calculated?

How to use the Chop Index ?

The main purpose of the Chop Index is to detect movements. So, the main use is to open an order when the trend is about to start and to close the order when the trend is about to consolidate.

  • When the Chop Index is above 62,. This is a open order signal.
  • When the Chop Index is below 38. This is a close order signal.
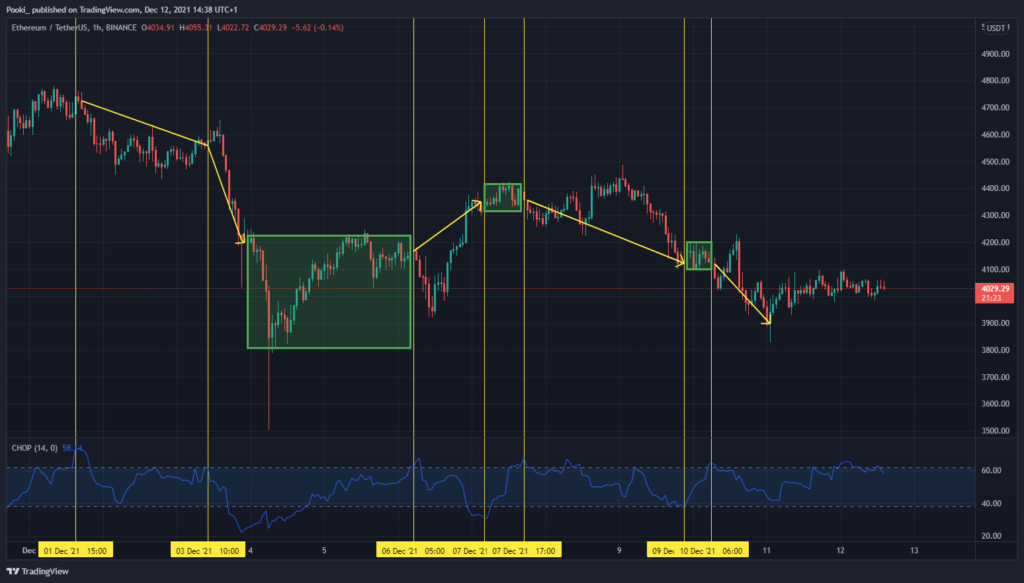
Yellow arrows show trends, green boxes show consolidation. Example on ETH/USDT on Binance in 1H.

The strategy of incorporating the Chop Index can be used in 1H for intraday but can be more reliable on higher periods : 1D and 1W. It doesn’t tell you in which direction the price will go, but the momentum. Do not forget to mix it with trend indicators : RSI, Vortex, …

A trading bot with the Chop Index

Example of strategy with Chop Index.
Test results with the Choppiness condition.

The best part is that this demo strategy is available on the store on botcrypto. This means that you can now create a trading robot with this strategy!


The complete tutorial on the Choppiness Index Read More »