Pivot points are dynamic prices that define resistance and support relative to a benchmark price. It is easy to use which makes it a good technical indicator when starting out in technical analysis, because the “buy supports and sell resistances” method remains simple and effective. These points are mainly used on the stock market but work just as much on the crypto market.
What are the pivot points ?
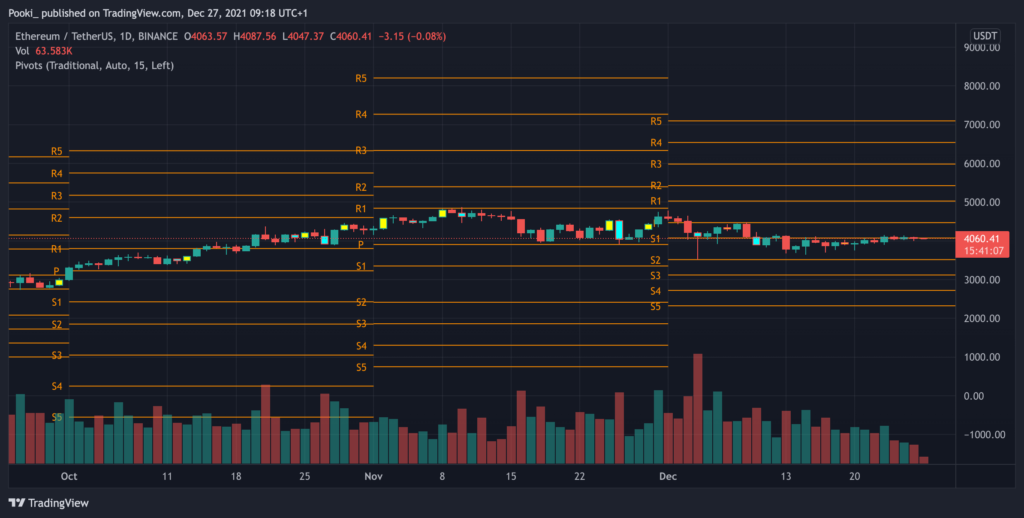
Pivot points are dynamic prices that define resistance and support with respect to a reference price, noted point P). The resistances are noted R and the supports S. The closest resistance is R1 then the next one is R2 and so on until R5. The logic is the same for supports. The closer the price gets to a distant support or resistance, the more likely it is to change direction (so you have to take your profits).
The advantage of pivot points is that you have a guarantee of profit if you buy support and sell resistance. This is a significant advantage compared to moving averages.
- If the price crosses R1 upward, the price is likely to rebound downward. If the price reaches R2, the probability of retracing is even higher.
- If the price crosses S1 lower, the price is likely to rebound higher. If the price reaches S2, the probability of retracing is even higher.
Comment est-ce que les points pivots sont calculés ?
Pivot point (PP) = (High + Low + Close)/3
R1 = (2xPP) – Low
R2 = PP + High – Low
R3 = High + 2x(PP-Low)
R4 = 3xPP + High – 3xLow
S1 = (2xPP) – High
S2 = PP – High + Low
S3 = Low – 2x(High-PP)
S4 = 3xPP – 3xHigh + Low
This is only a method of calculation, assuming the candles are OHCL. There are several methods of calculating pivot points, you can find 29 of them on this site: https://www.sierrachart.com/index.php?page=doc/PivotPoints.html
How to use the pivot points ?
The main purpose of points is to stagger one’s buying and selling according to the position of the price. You will find 2 strategies:
Strategy 1: Buy the S1, Sell the R1
The points S1 and R1 are most often reached but offer only limited benefits. It is a simple strategy, with limited risk and advantageous for scalping, the risk of which relates to the management of allocated funds.
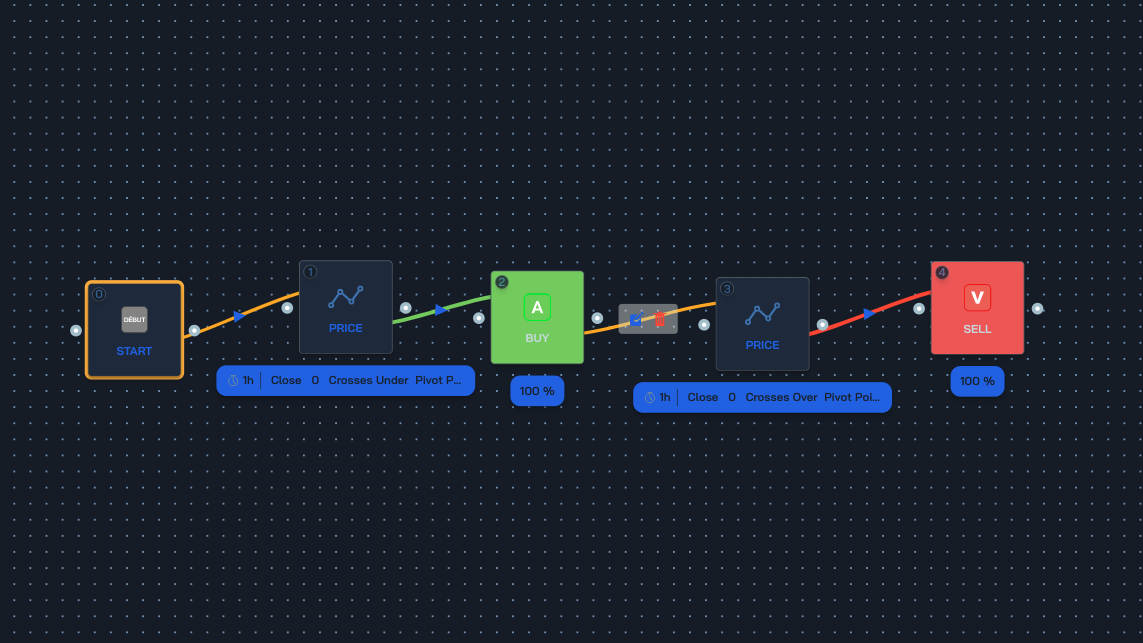
- If the price hits S1, buy with 100% funds.
- If the price hits R1, sell 100% of the position.
Strategy 2: Stagger purchases and sales
This strategy consists of removing the risk from the management of funds by dividing the volume of buying and selling according to the level reached. It’s a bit more complex to set up but your entry points and average exit points are more optimized and your profits better. It is a more effective strategy when the price is more volatile.
NB: You can combine this strategy with momentum indicators to take advantage of times of high volatility.
- If the price hits S1, buy with 50% of the funds. If the price hits S2, buy with 30% of the funds. If the price hits S3, buy with 20% of the funds.
- If the price hits R1, sell the first trade. If the price reaches R2, sell the 2nd trade. If the price reaches R3, sell the 3rd trade
NB: To limit the risk, I can add a condition asking to close all trades if the price goes from R2 to R1.
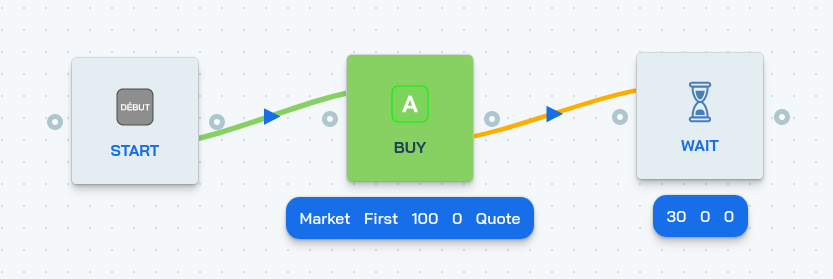
Bot trading with pivot points, 2 strategies
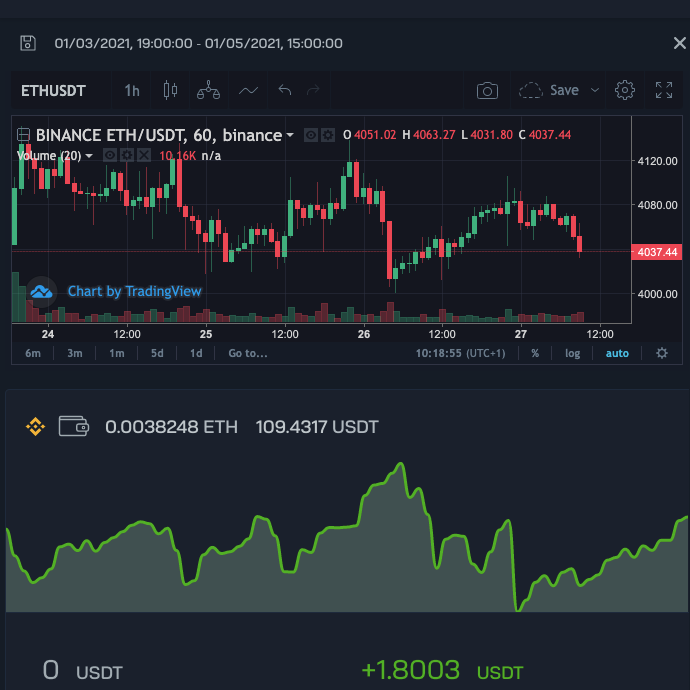
The best part is that this demo strategy is available on the store on botcrypto. This means that you can now create a trading robot with this strategy!