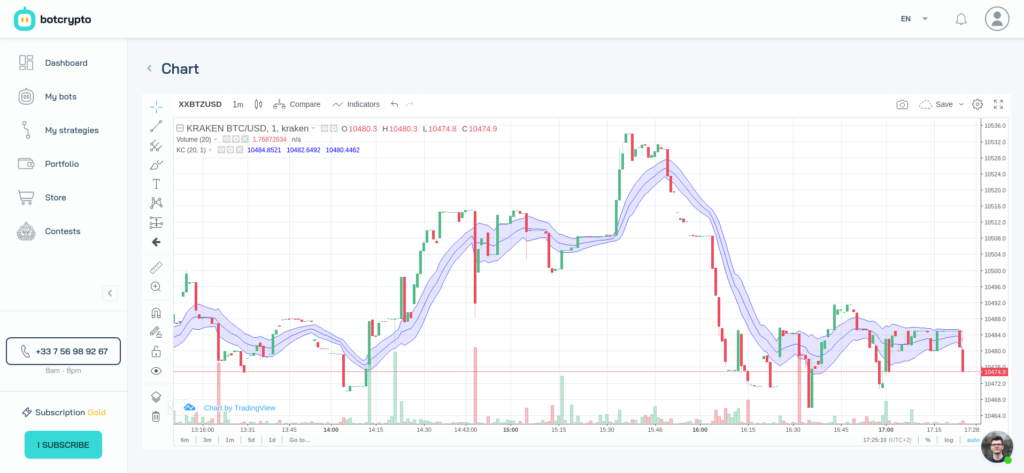
Keltner channels (KC) indicator, or Keltner bands, consists of an upper envelope above a halfway line and a lower envelope below the halfway line. Price moves in relation to these bands give many indications in the manner of Bollinger bands. You can use this indicator in your crypto trading bots on Botcrypto.
How to interpret Keltner bands?
The main occurrences to look for when using Keltner channels are breaks above the upper envelope or below the lower envelope.
A break above the top envelope means that the market is overbought. Conversely, a breakthrough below the lower envelope means that the market is oversold.
Where there is no trend, breaks can generally lead to corrections such that the price moves back towards the median line.
During an uptrend, a breakthrough above the upper envelope can be seen as a sign of strength and the uptrend is likely to continue.
Conversely, during a downtrend, a breakthrough under the lower envelope can be seen as a sign of strength and the downward trend is likely to continue.
It is best to use Keltner channels with additional technical analysis tools. In addition, historical analysis is useful to determine the best parameters when setting up the indicator. Indeed, depending on the markets, the multiplier can be different to adjust the width of the bands or envelopes.
How to calculate Keltner channels ?
- Halfway line : exponential moving average of close prices
- Up ligne : halfway line + X * ATR
- Down line : halfway line – X * ATR
X = Multiplier parameter
ATR = exponential moving average of True Range
References :
– Keltner channels on TradingView
– Keltner channels on Investopedia