A few days ago, @cryptomonk asked on his Twitter account which technical indicators could have convinced traders to sell at the Bitcoin top in April 2021. Here is a selection of the best answers.
The RSI (Relative Strength Index) indicator
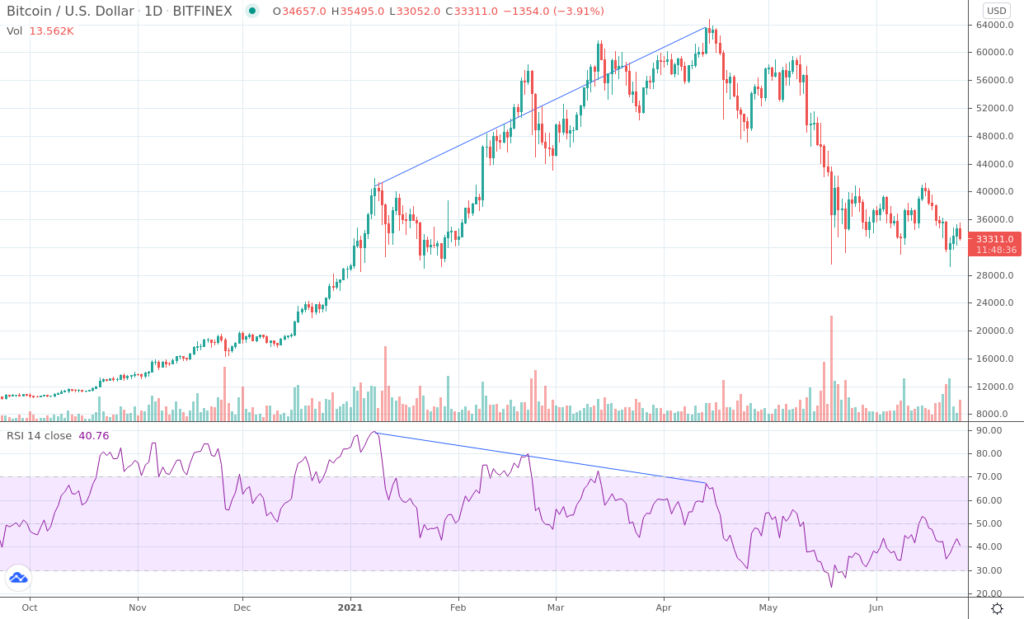
RSI divergences on high time units are particularly reliable and there was no exception during the bitcoin bull run earlier this year. From the first peak on February 21, 2021, a divergence of the RSI was visible in daily. The other two peaks, on March 13, 2021 and April 13, 2021, accentuated the divergence. In the end it was a very long bearish divergence of the RSI that we could see building up little by little over several months. The price of Bitcoin was then above $56,000.
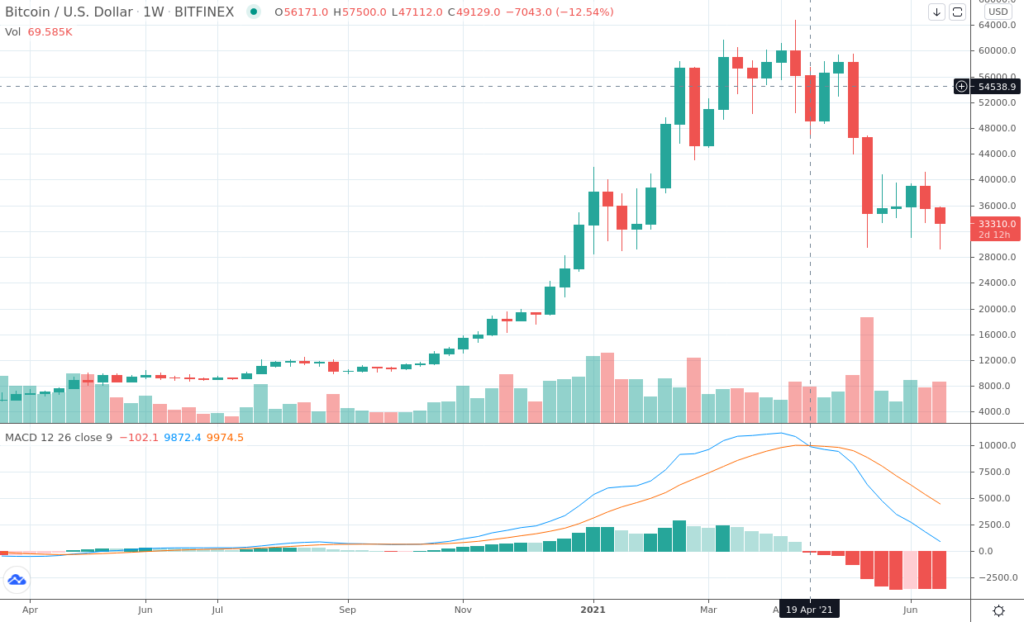
The MACD (Moving Average Convergence Divergence) indicator
The MACD is constructed from exponential moving averages and has two lines, the MACD and the signal line. An upward crossing of the MACD with the signal line means that we have a buy signal, and a downward crossing means that we have a sell signal. And this is exactly what was observed during the candle of the week of April 19, 2021. The price of Bitcoin was then above $48,000.
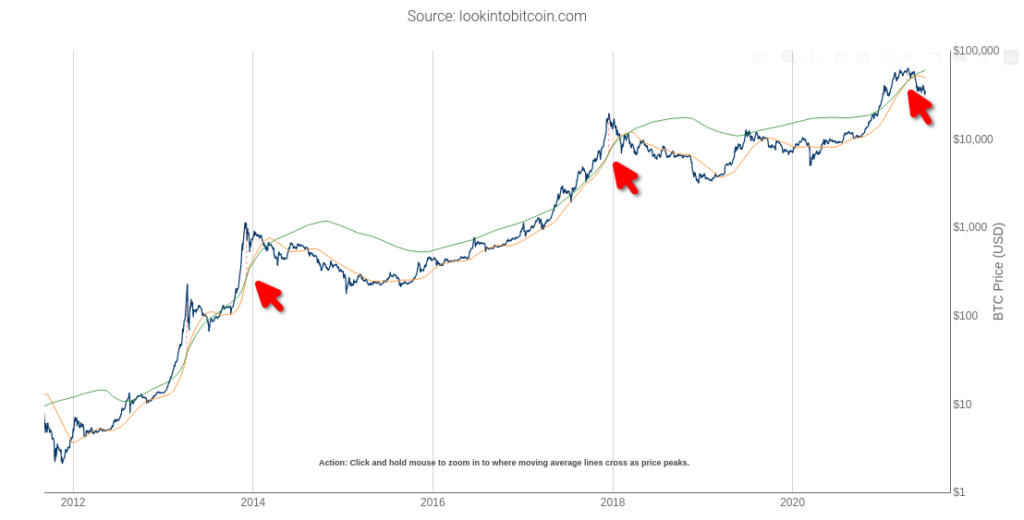
The Pi Cycle Top indicator
The Pi Cycle Top is a technical indicator much less known than the two previous ones. But it has the merit of having indicated the highest points of the last 3 big bitcoin bull runs! It consists of two lines, a yellow one corresponding to a MA111, and a green one corresponding to 2MA350. It is a very long term indicator that can only be used in daily trading. An upward crossing of the yellow line with the green line indicates a sell signal. The price of Bitcoin was then over $60,000!
And you, which technical indicators pushed you to sell at the top of bitcoin prices? Which ones prevented you from doing so? Share them in comments so everyone can be better armed during the next bull run 😉