Théo

End of Botcrypto

We are very sad to tell you that Botcrypto will shut down its servers on 30 September 2023. We started this adventure in 2017 and it has been a wonderful journey. But we sadly did not succeed to become a profitable company. You have maybe already seen that there are not been a lot of updates the last two years because we are less and less available for the website. So now is the moment to stop everything before the quality of the service degrades.

Starting of today, you will not be available to take a new subscription. If you are already subscribed, you will be able to use your subscription until the end or until 30 September 2023. All subscription automatic renewals will be canceled.

On 30 September 2023, bots will be stopped, servers will shut down, and you will not be able to access Botcrypto anymore.

If you have any questions or if you want to get your data, feel free to contact us at support@botcrypto.io.

Thank you to everyone who helped us in this journey.

Regards,

Constantin and Théo, cofounders of Botcrypto

End of Botcrypto Read More »

The complete tutorial on the Vortex indicator

The Vortex is a very useful technical indicator for detecting trend reversals. It is easy to use which makes it a good technical indicator when you are a beginner in technical analysis. Unlike moving averages or RSI, it is a very recent indicator since it was invented in 2010 by Etienne Botes and Douglas Siepman. This does not change its effectiveness as you will discover in our examples…

What is the Vortex ?

The Vortex consists of two lines that capture positive and negative trends. The VI+ line represents the positive trend (in blue on the graph). The VI- line represents the negative trend (in red on the chart). The higher the value of a line, the stronger the trend it represents.

  • If VI+ is above VI-, the trend is upward (it is more positive than negative).
  • If VI- is above VI+, the trend is downward (it is more negative than positive).

And the larger the space between the two lines, the stronger the trend.

Bitcoin price chart with the Vortex indicator
Between October and November, we see that VI+ is strongly above VI-. The trend is strongly upward.

The Vortex is a general purpose indicator that can be used on all markets (stocks, forex, cryptos, …) and all time units.

How is the Vortex calculated?

How to use the Vortex ?

The main purpose of the Vortex is to detect changes in trends. So, did you understand how to detect trend changes by reading the previous paragraph? It’s easy and most importantly, it makes sense 😉

  • When the VI+ line, which represents the positive trend (in blue), crosses over the VI- line, which represents the negative trend (in red), the trend goes up. This is a buy signal.
  • When the VI+ line representing the positive trend (in blue) passes below the VI- line representing the negative trend (in red), the trend goes down. This is a sell signal.
Buy and sell signals with the Vortex on a bitcoin chart

That’s it! From a practical point of view, traders usually use the Vortex with a period of 14. However, it should be noted that the inventors of this indicator recommend a higher period for small time units. For example, a period of 34 or 55 on typical 5-minute periods.

A trading robot with the Vortex

At botcrypto, we don’t see the point of spending our days monitoring the markets. We’d rather enjoy life 😉 So here’s an example of a trading robot built on botcrypto that buys when VI+ crosses VI- up, and sells when VI+ crosses VI- down.

Diagram of the Vortex Cross strategy on botcrypto
The Vortex Cross strategy on botcrypto.

It is a very simple strategy but it already gives very good results! We can see below with a simulation on the year 2021 that there were nice buy and sell signals, for example between August and September and between October and November.

Graph of the results of a backtest with the Vortex Cross strategy on botcrypto
The result of a backtest with the Vortex Cross strategy on botcrypto.

The best part is that the Vortex Cross strategy is available on the store on botcrypto. This means that you can now create a trading robot with this strategy!


A big thanks to Nicocrypto for his contribution to this article. It is to him that you owe the addition of the Vortex on botcrypto!

The complete tutorial on the Vortex indicator Read More »

The complete tutorial on the VWAP indicator

If you are looking to determine the trend of the day to improve your positions and your results, the VWAP (Volume-Weighted Average Price) is the ideal technical indicator. Let’s go for a complete overview of this indicator, including the different ways to interpret it and an application with trading robots!

What is the VWAP (Volume-Weighted Average Price) ?

VWAP stands for Volume-Weighted Average Price. What does this mean? When you calculate an average (e.g. a moving average), all prices are taken into account in the same way. Conversely, VWAP gives more weight to prices that had a lot of volume and less weight to prices that had little volume. It thus gives a more accurate picture of what happened.

On a graph, the VWAP corresponds to a line that is added next to the prices. It is important to know that the VWAP is calculated according to a period and that it is reset at the beginning of each period. In general, it is used for a period of one day. This is why we see on the graph below the sudden movements of the indicator at the beginning of each day. It resets itself.

Graph of the VWAP indicator
Resets are visible at the beginning of each day.

The VWAP indicator is very useful for determining the direction of the trend during the day. It will quickly move above or below the prices and thus indicate the direction of the trend. If there is no trend, it will be a flat line very close to the price.

It is also worth noting that the VWAP lags behind the prices. A delay that increases from hour to hour due to its construction which integrates in the calculation all the volume data since the opening of the day. It is nonetheless interesting precisely because it integrates price and volume.

How is the VWAP calculated?

How to use the VWAP ?

The VWAP is mainly used to give the trend of the day:

  • When the price is above the VWAP, the trend is up.
  • When the price is below the VWAP, the trend is down.

It can also be used to give buy and sell signals:

  • When the price crosses the VWAP, it is a buy signal (the trend becomes bullish).
  • When the price crosses the VWAP, it is a sell signal (the trend becomes bearish).
Graph of the VWAP indicator with an upward cross
An upward cross in the VWAP indicator.

Finally, it can take on the role of support and resistance.

A trading robot with the VWAP

Why monitor charts and technical indicators yourself? One can build on the previous information to build a cryptocurrency trading robot with the VWAP. The VWAP Cross strategy below buys bitcoins when the VWAP crosses the price up (when the trend becomes bullish), and sells bitcoins when the VWAP crosses the price down (when the trend becomes bearish).

Diagram of the VWAP Cross strategy on botcrypto
The VWAP Cross strategy on botcrypto.

We can see on the results of the backtest below the different orders that have been taken.

Result of the VWAP Cross strategy on botcrypto
The result of a backtest with the VWAP Cross strategy on botcrypto.

The result is quite interesting since there is a profit of almost 20 USDT with an initial investment of 1000 USDT! But maybe the easiest way is to see for yourself? You can try the VWAP Cross strategy for free on botcrypto. You can even copy it to improve it and create your own trading strategies with VWAP.

Result of the VWAP Cross strategy on botcrypto
The result is quite interesting…

Now you know everything you need to know about using the VWAP. If you want to dig deeper into how this indicator works, CMartel94’s commentary is full of additional videos. Many thanks to him. And feel free to share your tips for the community in comments!

The complete tutorial on the VWAP indicator Read More »

Back 2 School Trading Contest 2021 🏆 [1000$ to win]

We are very pleased to announce the launch of a new bitcoin and cryptocurrency trading contest, the Back 2 School Trading Contest. This is the perfect opportunity for all traders to get back on the markets after the holidays, to progress in a friendly atmosphere and above all to try to win the 1000 USDT that we are putting at stake! More details below.

Rules

Your goal? To make the biggest profit in 1 week with 2 BTC. You will start with 1 virtual wallet of 1 BTC on Kraken and 1 virtual wallet of 1 BTC on Binance to be able to take advantage of the different pairs on these platforms.

  • All cryptocurrencies pairs available on Botcrypto are allowed.
  • All cryptocurrencies exchanges available on Botcrypto are allowed.
  • All strategies are allowed.
  • Trading bots are allowed.
  • Manual orders are allowed.

Start date : 09/10/2021 19:00 CET
End date : 09/17/2021 19:00 CET

Additional rules can be found on our Helpdesk. Botcrypto reserves the right to change the rules and exclude participants at any time.

Prizes

To reward the best traders, we are offering 1000 USDT which will be distributed among the winners.

  • 1st place 500 USDT
  • 2nd place 300 USDT
  • 3rd place 200 USDT

You read that right. Virtual trading, but real earnings! Are you interested? Then take advantage of the next few days to practice creating trading bots with Botcrypto, and register now for the contest!

Back 2 School Trading Contest 2021 🏆 [1000$ to win] Read More »

3 technical indicators that indicated to sell at the Bitcoin top

A few days ago, @cryptomonk asked on his Twitter account which technical indicators could have convinced traders to sell at the Bitcoin top in April 2021. Here is a selection of the best answers.

The RSI (Relative Strength Index) indicator

RSI divergences on high time units are particularly reliable and there was no exception during the bitcoin bull run earlier this year. From the first peak on February 21, 2021, a divergence of the RSI was visible in daily. The other two peaks, on March 13, 2021 and April 13, 2021, accentuated the divergence. In the end it was a very long bearish divergence of the RSI that we could see building up little by little over several months. The price of Bitcoin was then above $56,000.

Daily RSI chart for the BTC/USDT pair
Daily RSI for the BTC/USD pair (source: TradingView)

The MACD (Moving Average Convergence Divergence) indicator

The MACD is constructed from exponential moving averages and has two lines, the MACD and the signal line. An upward crossing of the MACD with the signal line means that we have a buy signal, and a downward crossing means that we have a sell signal. And this is exactly what was observed during the candle of the week of April 19, 2021. The price of Bitcoin was then above $48,000.

MACD chart in weekly for the BTC/USD pair
The MACD in weekly for the BTC/USD pair (source: TradingView)

The Pi Cycle Top indicator

The Pi Cycle Top is a technical indicator much less known than the two previous ones. But it has the merit of having indicated the highest points of the last 3 big bitcoin bull runs! It consists of two lines, a yellow one corresponding to a MA111, and a green one corresponding to 2MA350. It is a very long term indicator that can only be used in daily trading. An upward crossing of the yellow line with the green line indicates a sell signal. The price of Bitcoin was then over $60,000!

Pi Cycle Indicator daily chart for the BTC/USD pair
The Pi Cycle Indicator in daily on the BTC/USD pair (source: lookintobitcoin.com)

And you, which technical indicators pushed you to sell at the top of bitcoin prices? Which ones prevented you from doing so? Share them in comments so everyone can be better armed during the next bull run 😉

3 technical indicators that indicated to sell at the Bitcoin top Read More »

Everything you need to know about backtests

When you discover trading bots, you immediately want to know what the results will be. Even if it is not possible to guarantee results, we can still use tools to try to predict the behavior of a strategy. In this article, we will present backtests, one of the most well-known tools!

What is a backtest ?

A backtest is a test into the past. When we backtest a trading bot, we will test the behavior of the trading bot on the data of the last 3 days, the last 6 months, even the last 3 years with virtual funds. So there is no risk. A backtest allows us to answer the question “What would my trading bot have done if I had launched it 3 days ago, 6 months ago, 3 years ago“.

Here is an example of a backtest running on the Botcrypto platform, with the vortex-bull strategy that you can import for free from the strategy store. I have configured the backtest to test the strategy over the whole year 2020 on the bitcoin/euro pair on the Kraken trading platform. You can see at a glance the different moments when the backtest bought and sold.

Example of a backtest with the vortex-bull strategy on Botcrypto

Why you need to do backtests ?

Backtests provide a lot of information on the effectiveness of a strategy, and answer a number of questions:

  • Has the strategy been properly configured?
  • Is it effective during the test period?
  • What are its characteristics during the test period?

You can usually see many statistics and details of all orders. Here are the details of the previous backtest. There can be global statistics, such as profits made or success rate. You can also see the details of all orders, including the fees taken (virtually) by the exchange.

The detailed interface of the results of a backtest on Botcrypto

This allows you to check whether the strategy is effective during the test period. Did it take losing trades? If so, how to avoid them? Is it sensitive to fees? With this information, you can modify the strategy to improve your results.

What are the limits of backtests?

First of all, it should not be forgotten that a backtest only tests a strategy over a given period of time. The results are therefore not universal, and if your backtest took place in an uptrend, it does not give any interesting information for a downtrend. Therefore, just because a backtest of your trading bot has made +300% in the last 6 months, does not mean that your trading robot will make +300% in the next 6 months. In fact, you simply have to remember that past results are no guarantee of future results.

Moreover, backtests never completely correspond to what would have happened in reality, because they depend on factors that cannot be taken into account such as the order execution time or the spread (the price difference between the buy and sell price). All software that performs backtesting is therefore obliged to make shortcuts and simplifications. The backtest shows how everything works in theory.

These various limitations do not prevent backtests from being very useful to get an overview of the functioning and potential of a strategy.

How to make backtests?

A backtest simply consists in analyzing each candle of a given period with its strategy. Nothing prevents you from analyzing the charts by hand on TradingView to replicate how your strategy works. But most trading bots, whether ready for use, customizable or installable, allow you to do backtests almost instantaneously. This saves you a lot of time.

Obviously, if you want to backtest your own strategies, you would have to go through platforms that allow you to design strategies, such as our Botcrypto platform where no technical knowledge is required, or Freqtrade where we have written an installation and configuration tutorial.

Our tips for setting up the best backtests

Finally, here are some tips to configure the best backtests :

  • Reproduce the backtests with the conditions closest to your trading conditions to get the most relevant results. If you can set the initial backtest funds, set a realistic amount. If you can configure the fee taken by the platform, configure that as well.
  • Perform multiple backtests in different market conditions. If you’re looking to build a strategy that takes advantage of Bitcoin’s volatility, don’t settle for just one backtest. Instead, try to run several backtests, on different trends, over different periods of time, to get the most representative results possible.
  • When building a strategy, change only one parameter at a time between each backtest. This will make it easier to understand the results of the backtests.
  • And if you are satisfied with the result of your strategy, then save it, with a copy for example. This will prevent you from losing your progress in the search process.

Everything you need to know about backtests Read More »

[Tutorial] Your first trading bot with Zenbot

Introduction

Zenbot is a free and open source bitcoin and crypto trading bot. It is used in command line and relies on Node.js and MongoDB. It is a serious competitor of Freqtrade that we have already mentioned. It is used on the command line and is therefore rather reserved for confirmed users. To create trading bots without technical knowledge, visit Botcrypto!

Prerequisites

This tutorial has been realized on a Ubuntu 20.04 server.

We will need Node.js, MongoDB and git.

  • To install the various prerequisites, run the following command:

sudo apt update && sudo apt install git && sudo apt install nodejs && sudo apt install npm && sudo apt-get install build-essential mongodb

Zenbot’s installation

  • First, we will clone the git repository by executing the command below:

git clone https://github.com/deviavir/zenbot.git

  • Once the download is complete, we will go to the zenbot folder:

cd zenbot

  • Then we will install the dependencies with the following two commands:

npm install

sudo npm link

Zenbot’s configuration

Zenbot can be configured in different ways. We will create a configuration file based on the example provided.

  • Execute this command to create your conf.js configuration file.

cp conf-sample.js conf.js

You can if you want check the different possible configurations of Zenbot by opening this file but for this tutorial we will keep the basic settings.

Zenbot’s usage

We will see how to do a backtest, a test in the past.

First you can use the command ./zenbot.sh list-selector to see all available pairs.

  • To perform a backtest we will need the data of a market. We will retrieve the BTC/EUR market of Coinbase Pro over 1 day with this command: ./zenbot.sh backfill gdax.BTC-EUR –days 1.

Once the data is downloaded (this can take time), we can perform our backtest. But we will have to choose which strategy to use.

You can access the list of all preconfigured Zenbot strategies by executing the following command: ./zenbot.sh list-strategies.

For this tutorial, we will test the trend_ema strategy based on exponential moving averages.

  • ./zenbot.sh sim gdax.BTC-EUR –strategy trend_ema

After running the backtest, an HTML file starting with “sim_result_gdax.BTC-EUR” was written to Zenbot’s simulations folder. You can open it in your browser to observe the results and the behavior of your strategy with a chart and some information about the trades of the backtest. This visualization is very interesting. Mine has 4 winning trades against 6 losing trades.

Results of my backtest with Zenbot

With Zenbot, you can also test your strategies in real time on the market in a fictitious way.

By executing this command ./zenbot.sh trade --paper --strategy trend_ema gdax.BTC-EUR I simulate the execution of the trend_ema strategy in the BTC-EUR market of Coinbase Pro. This method is called paper trading since it is equivalent to simulating the execution of the strategy on paper.

Running the strategy simulation on Zenbot

Your initiation to Zenbot is now over! You have discovered how to create a backtest and a real-time simulation. In a future article, we will see how to create your own strategy to customize actions. And in the meantime, don’t hesitate to read our guide on trading bots to become an expert!

[Tutorial] Your first trading bot with Zenbot Read More »

[Tutorial] Create your own trading bot strategy with Freqtrade

Introduction

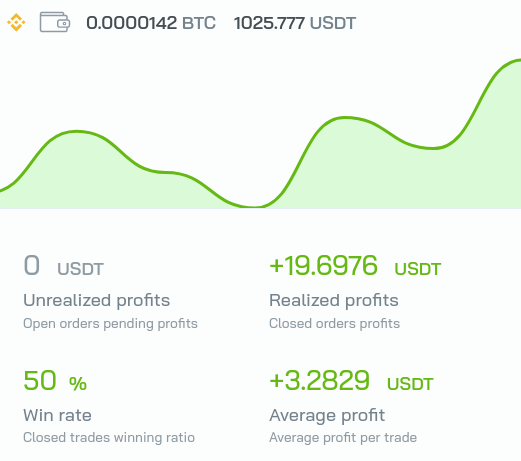
In our last article, we saw how to create our first trading bot with Freqtrade, but his results were not satisfactory. We will now discover how to build our own customized strategy.

Prerequisite

  • A full installation of Freqtrade, see our article.
  • Basics of technical analysis.
  • Basics in the python computer language.

Creation of a new strategy on Freqtrade

The strategies usable by Freqtrade are stored in the freqtrade/user_data/strategies folder and are python (.py) files.

To start, move to a terminal in the /freqtrade folder and activate its virtual environment with this command :

source .env/bin/activate;

Then create a new strategy called MyStrategy.

freqtrade new-strategy --strategy MyStrategy

After executing this command, a MyStrategy.py file was created in /freqtrade/user_data/strategies. It is this file that we will customize throughout this article. The final file is available at the end of the article.

Configuration of the strategy on Freqtrade

Configuring strategy settings

Open the MyStrategy.py file with a text editor. In the class, we will specify parameters that our strategy will have to respect.

We start by defining the minimal_roi, ROI meaning return on investment, which allows us to define to sell our assets at any moment of the strategy if a percentage of profit is reached independently from the rest of the strategy. For this tutorial, I have chosen a minimal_roi that at any moment of the strategy will engage a sale if the profits exceed 50%. Furthermore, if the trade has been open for more than 40 minutes, then a sale will be issued if the profits exceed 20%.

minimal_roi = {
  "40": 0.2,
  "0": 0.5
}

We are also going to set up a stop loss, to avoid having too big losses.

stoploss = -0.15

With this stop loss, if one of my trades registers a loss of more than 15%, a sell order will be issued.

We will then choose a unit of time for our bot this way (here, 5 minutes).

timeframe = '5m'
Addition of technical indicators to the strategy

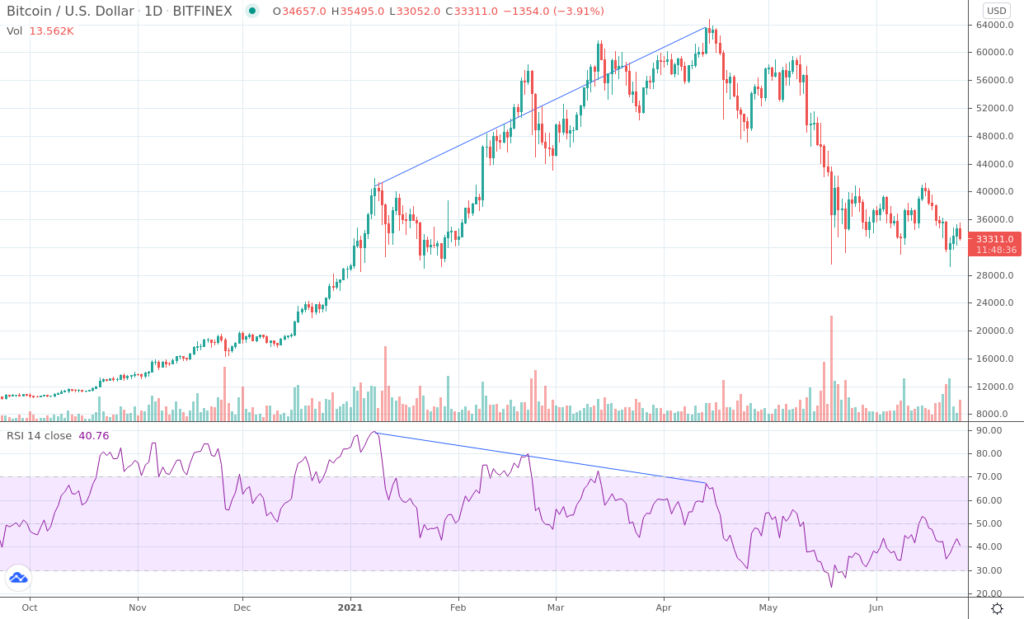
To add technical indicators to the strategy, we will modify the populate_indicators function. In this tutorial, I will use the Relative Strength Index, a technical indicator that we have already discussed many times.

dataframe['rsi'] = ta.RSI(dataframe)

After adding the indicator (you can of course add more), I end this function with a dataframe return.

return dataframe
Addition of conditions of buy/sell

To add a buy condition, we need to modify the function named populate_buy_trend and then add our condition inside as well as a return of the dataframe like this.

dataframe.loc[
(
(dataframe['rsi'] < 30)
),
'buy'] = 1

return dataframe

In this example, I decide that a buy order is sent if the ROI is less than 30.

It works the same way for the sell condition. I decide that a sell order is issued when the ROI is greater than 70.

dataframe.loc[
(
(dataframe['rsi'] > 70)
),
'sell'] = 1

return dataframe

There you go! All that remains is to test our strategy. If you don’t know how to do it, I redirect you to our tutorial on how to use Freqtrade, where we presented how it works in general. This strategy is not intended to be implemented with your funds. It is very simple, and its main interest is to show you how to build your own strategy with Freqtrade. You now have all the cards in hand to create and customize your trading bots with Freqtrade! The next step is to increase the results of your strategy with an incredible freqtrade feature, Hyperopt. Happy trading!

[Tutorial] Create your own trading bot strategy with Freqtrade Read More »

Comparison of the best free and open source crypto trading bots

In this article, I will compare different open source crypto trading bots. Open source trading bots have several advantages. They are particularly reliable because anyone can check and correct their code. They also have many different features. They are very complete products that have nothing to envy to commercial solutions, even though they are available for free. Pretty interesting, isn’t it? The main drawback is related to the interface and the use. Generally speaking, you need fairly advanced technical knowledge to understand and deploy them.

You’ve heard about trading bots, but you’re still not sure what they are and how they work? Then go ahead and read our ultimate guide to trading bots.

For each project, the title corresponds to a link to the bot’s GitHub repository.

Zenbot

Zenbot is a command line crypto trading bot. It uses node.js and MongoDB to operate. Zenbot supports Windows/Linux /MacOS 10 (or via Docker).

Zenbot supports a large number of exchanges and offers the way via a plugin to add even more to the list. It has most of the normal and advanced features that you can ask a trading bot for.

Active developmentyes
Easy to installyes
Easy to useyes
Backtestsyes
Manual orderyes
Graphical interfaceno
Webhooksyes

Hummingbot

Hummingbot is software that allows you to create and execute customizable trading strategies on Windows/Linux/MacOS.

Hummingbot has a documentation and an academy allowing a fast and complete learning of the tool. Its installation couldn’t be easier.

Active developmentyes
Easy to installyes
Easy to useyes
Backtestsno
Manual orderno
Graphical interfaceno
Webhooksno

Gekko

Gekko is a platform for automating trading strategies in the cryptocurrency markets and can be used on the most popular operating systems (Windows, Linux and MacOS).

Gekko has a web interface which makes it easier to use, but is unfortunately no longer maintained.

Active developmentno
Easy to installno
Easy to useyes
Backtestsyes
Manual orderno
Graphical interfaceyes
Webhooksno

Freqtrade

Freqtrade is an algorithmic crypto trading software developed in python (3.6+) and supported on Windows, Linux and MacOS.

It is designed to support all major exchanges and be controlled by Telegram. It contains tools for backtesting and portfolio management as well as strategy optimization by machine learning. You can find our article on how to create your first trading robot with Freqtrade at this address.

Active developmentyes
Easy to installyes
Easy to useno
Backtestsyes
Manual orderno
Graphical interfaceno
Webhooksyes

So much for this comparison! You now know the advantages and disadvantages of the main open source trading bots for trading bitcoin and ethers. Do you know others? Have you developed your own? Tell us about it!

Comparison of the best free and open source crypto trading bots Read More »

They switched in 2020

They switched in 2020 Read More »