If you are looking to determine the trend of the day to improve your positions and your results, the VWAP (Volume-Weighted Average Price) is the ideal technical indicator. Let’s go for a complete overview of this indicator, including the different ways to interpret it and an application with trading robots!
What is the VWAP (Volume-Weighted Average Price) ?
VWAP stands for Volume-Weighted Average Price. What does this mean? When you calculate an average (e.g. a moving average), all prices are taken into account in the same way. Conversely, VWAP gives more weight to prices that had a lot of volume and less weight to prices that had little volume. It thus gives a more accurate picture of what happened.
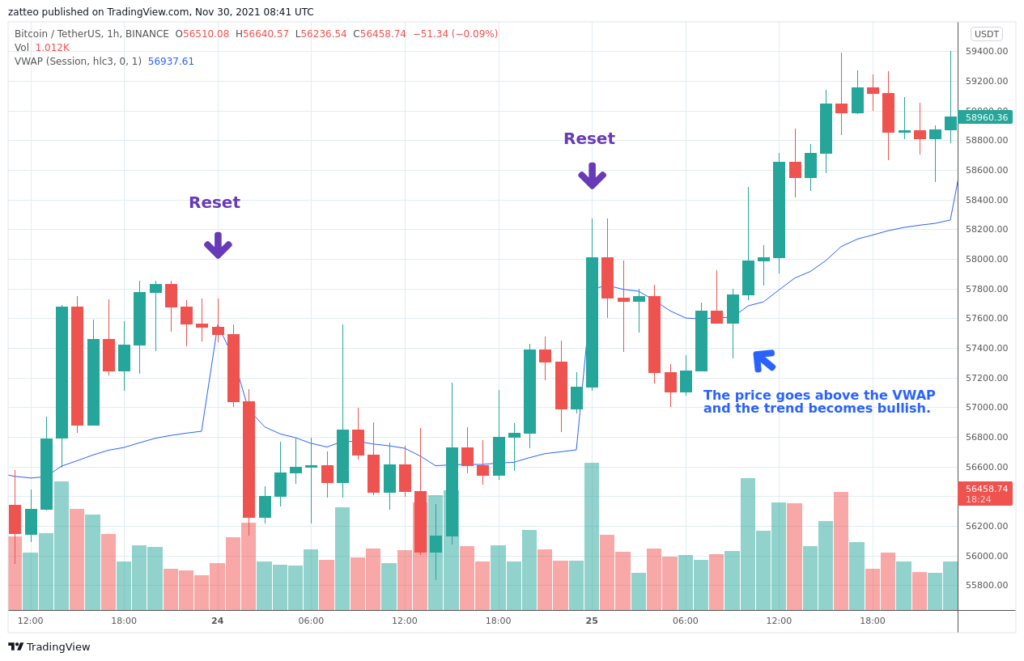
On a graph, the VWAP corresponds to a line that is added next to the prices. It is important to know that the VWAP is calculated according to a period and that it is reset at the beginning of each period. In general, it is used for a period of one day. This is why we see on the graph below the sudden movements of the indicator at the beginning of each day. It resets itself.
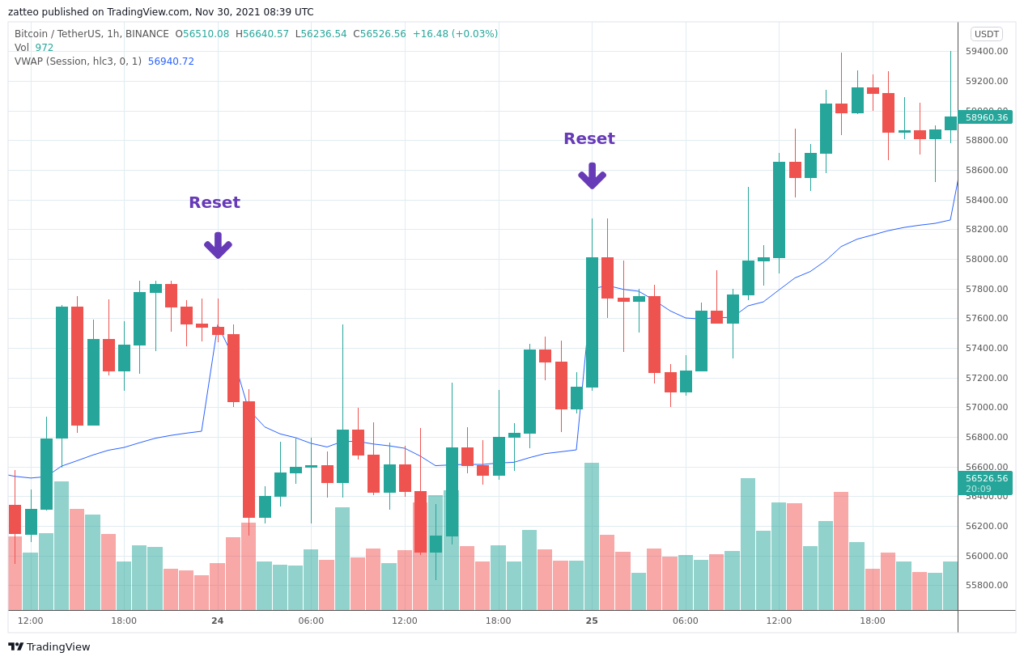
The VWAP indicator is very useful for determining the direction of the trend during the day. It will quickly move above or below the prices and thus indicate the direction of the trend. If there is no trend, it will be a flat line very close to the price.
It is also worth noting that the VWAP lags behind the prices. A delay that increases from hour to hour due to its construction which integrates in the calculation all the volume data since the opening of the day. It is nonetheless interesting precisely because it integrates price and volume.
How is the VWAP calculated?
The VWAP is available on most trading platforms like TradingView from which we have taken the formula below.
1. We calculate the Typical Price of the period.
(High + Low + Close) / 3
2. We multiply the Typical Price by the volume.
(Typical Price x Volume)
3. We add up all the Typical Prices.
Sum(Typical Price x Volume)
4. We add up all the volumes.
Sum(Volume)
5. We divide the two previous results.
VWAP = Sum(Typical Price x Volume) / Sum(Volume)
How to use the VWAP ?
The VWAP is mainly used to give the trend of the day:
- When the price is above the VWAP, the trend is up.
- When the price is below the VWAP, the trend is down.
It can also be used to give buy and sell signals:
- When the price crosses the VWAP, it is a buy signal (the trend becomes bullish).
- When the price crosses the VWAP, it is a sell signal (the trend becomes bearish).
Finally, it can take on the role of support and resistance.
A trading robot with the VWAP
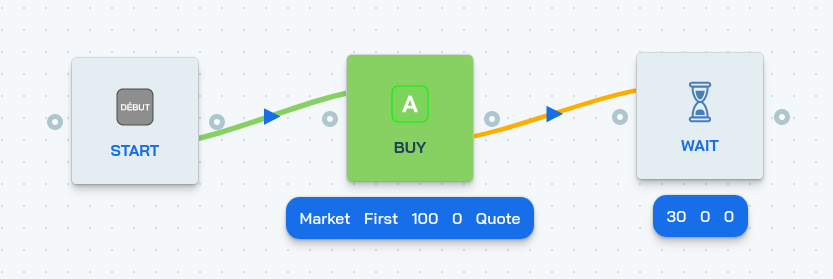
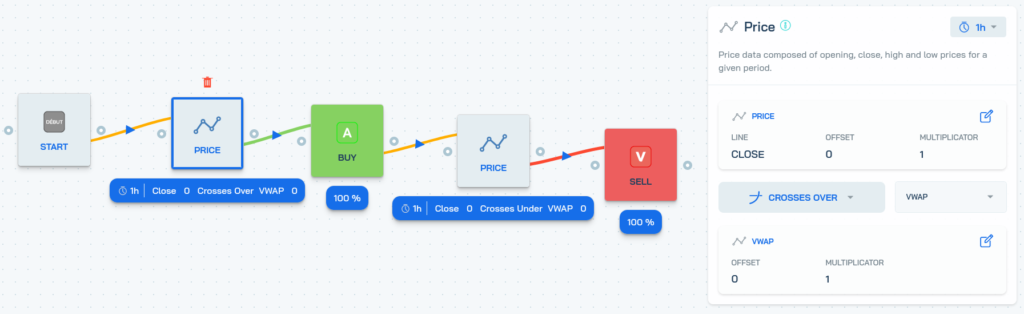
Why monitor charts and technical indicators yourself? One can build on the previous information to build a cryptocurrency trading robot with the VWAP. The VWAP Cross strategy below buys bitcoins when the VWAP crosses the price up (when the trend becomes bullish), and sells bitcoins when the VWAP crosses the price down (when the trend becomes bearish).
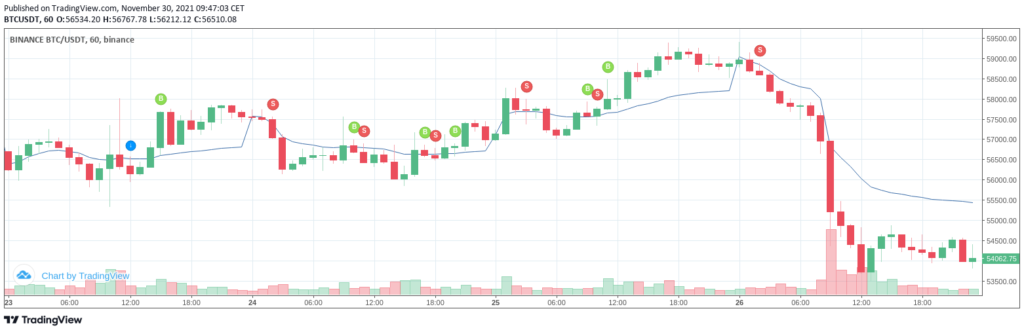
We can see on the results of the backtest below the different orders that have been taken.
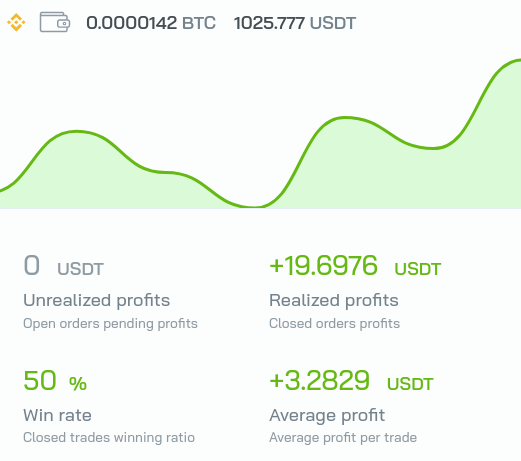
The result is quite interesting since there is a profit of almost 20 USDT with an initial investment of 1000 USDT! But maybe the easiest way is to see for yourself? You can try the VWAP Cross strategy for free on botcrypto. You can even copy it to improve it and create your own trading strategies with VWAP.
Now you know everything you need to know about using the VWAP. If you want to dig deeper into how this indicator works, CMartel94’s commentary is full of additional videos. Many thanks to him. And feel free to share your tips for the community in comments!