Complete tutorial on fear & greed index (FGI)
The fear & greed index (FGI) is an indicator that gives the mindset of the crypto market. It is based on many parameters, some of them technicals, some of them socials. It gives insights on when to buy and when to sell.
What is the fear & greed index (FGI) ?
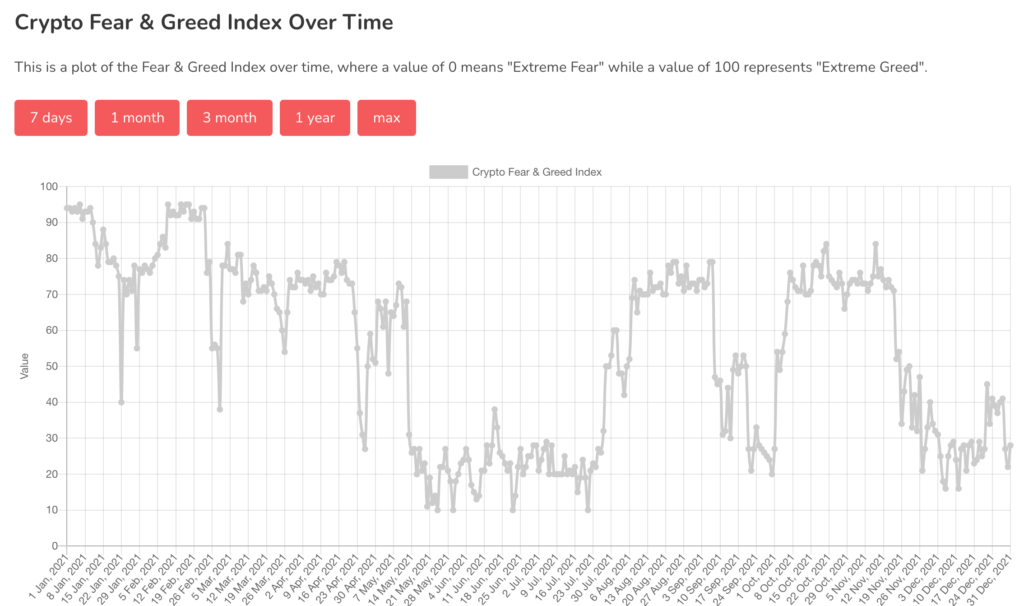
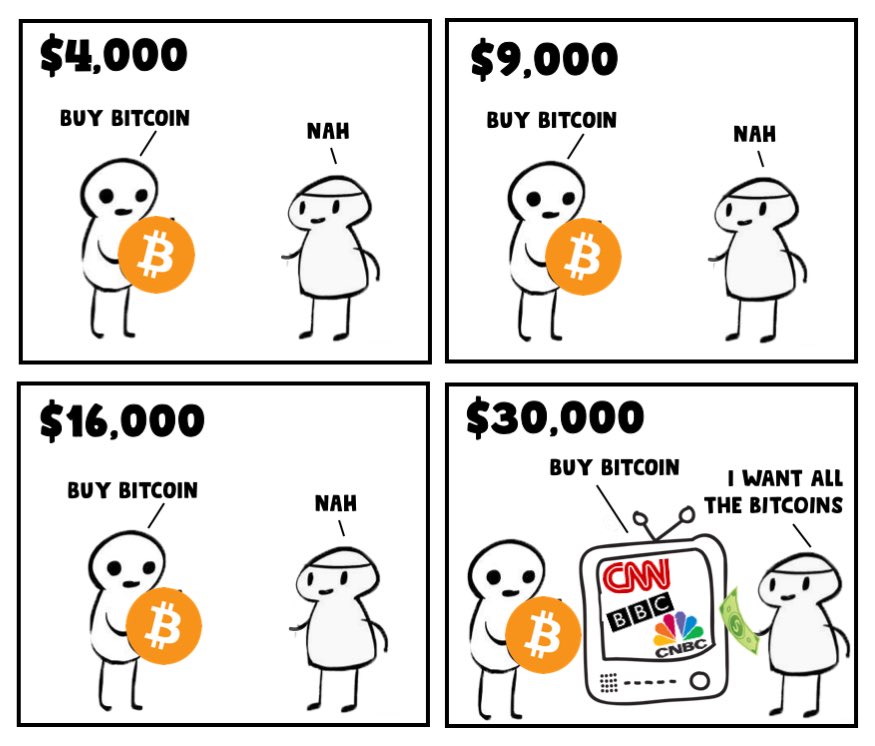
The fear and greed index is an indicator, whose values goes from 0 to 100. When the value goes closer to 0, the market is in fear status. When the values goes closer to 100, the market is in greed status. In other words, when the market is in fear, actors tend to sell their assets while being in FUD (Fear, Uncertainty, Doubt) ; When the market is in greed, actors tend to buy assets while being in FOMO (Fear of Missing Opportunity). You can find the source index here : https://alternative.me/crypto/fear-and-greed-index/
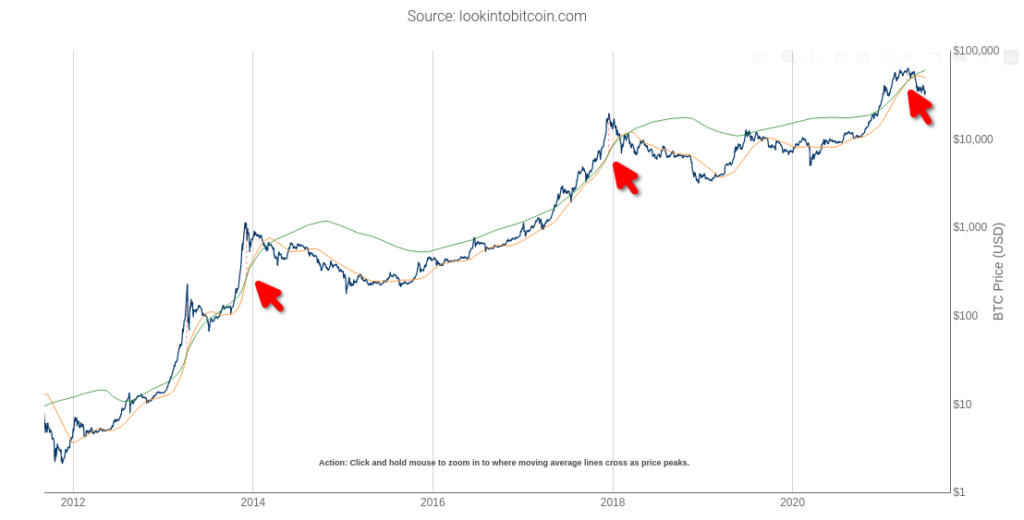
The idea here is to “buy the fear”, meaning that you buy the assets that actors are selling (because of too much loss), then sell them when everybody wants them. As a result, you buy when the price hits its lows, you sell when the price hits its highs. This is a kind of strategy that whales tend to use.
How is the fear and greed index calculated ?
Let’s take a look at the five indicators scaled from 0 to 100:
- Volatility : the program marks wider fluctuations as a sign of fear
- Market volume : once buying volumes increase significantly, the greed levels rise, too
- Social media : the client monitors, gathers and counts posts on various hashtags, to see how many interactions they receive over certain time-frames
- Dominance : once Bitcoin dominance rises, it indicates an increasing level of greed, and vice versa, when the dominance shrinks, it means that people get scared to invest in BTC.
- Trends : the program pulls Google Trends data for various Bitcoin-related search queries and crunches those numbers, especially the change of search volumes
NB : The calculation of the crypto FGI is not the same as the stocks FGI. The stocks FGI is defined by CNN : https://money.cnn.com/data/fear-and-greed/
How to use the FGI ?
The FGI is to be used preferably on BTC but is still quite relevant on other cryptos as BTC is still the market leader. The strategy here is to buy when FGI is in extreme fear, and sell when FGI is in extreme greed. As the FGI is calculated everyday, it is advised to use a daily strategy. Here is a simple example:
- If the FGI goes below 15, buy.
- If the FGI goes above 80, sell.
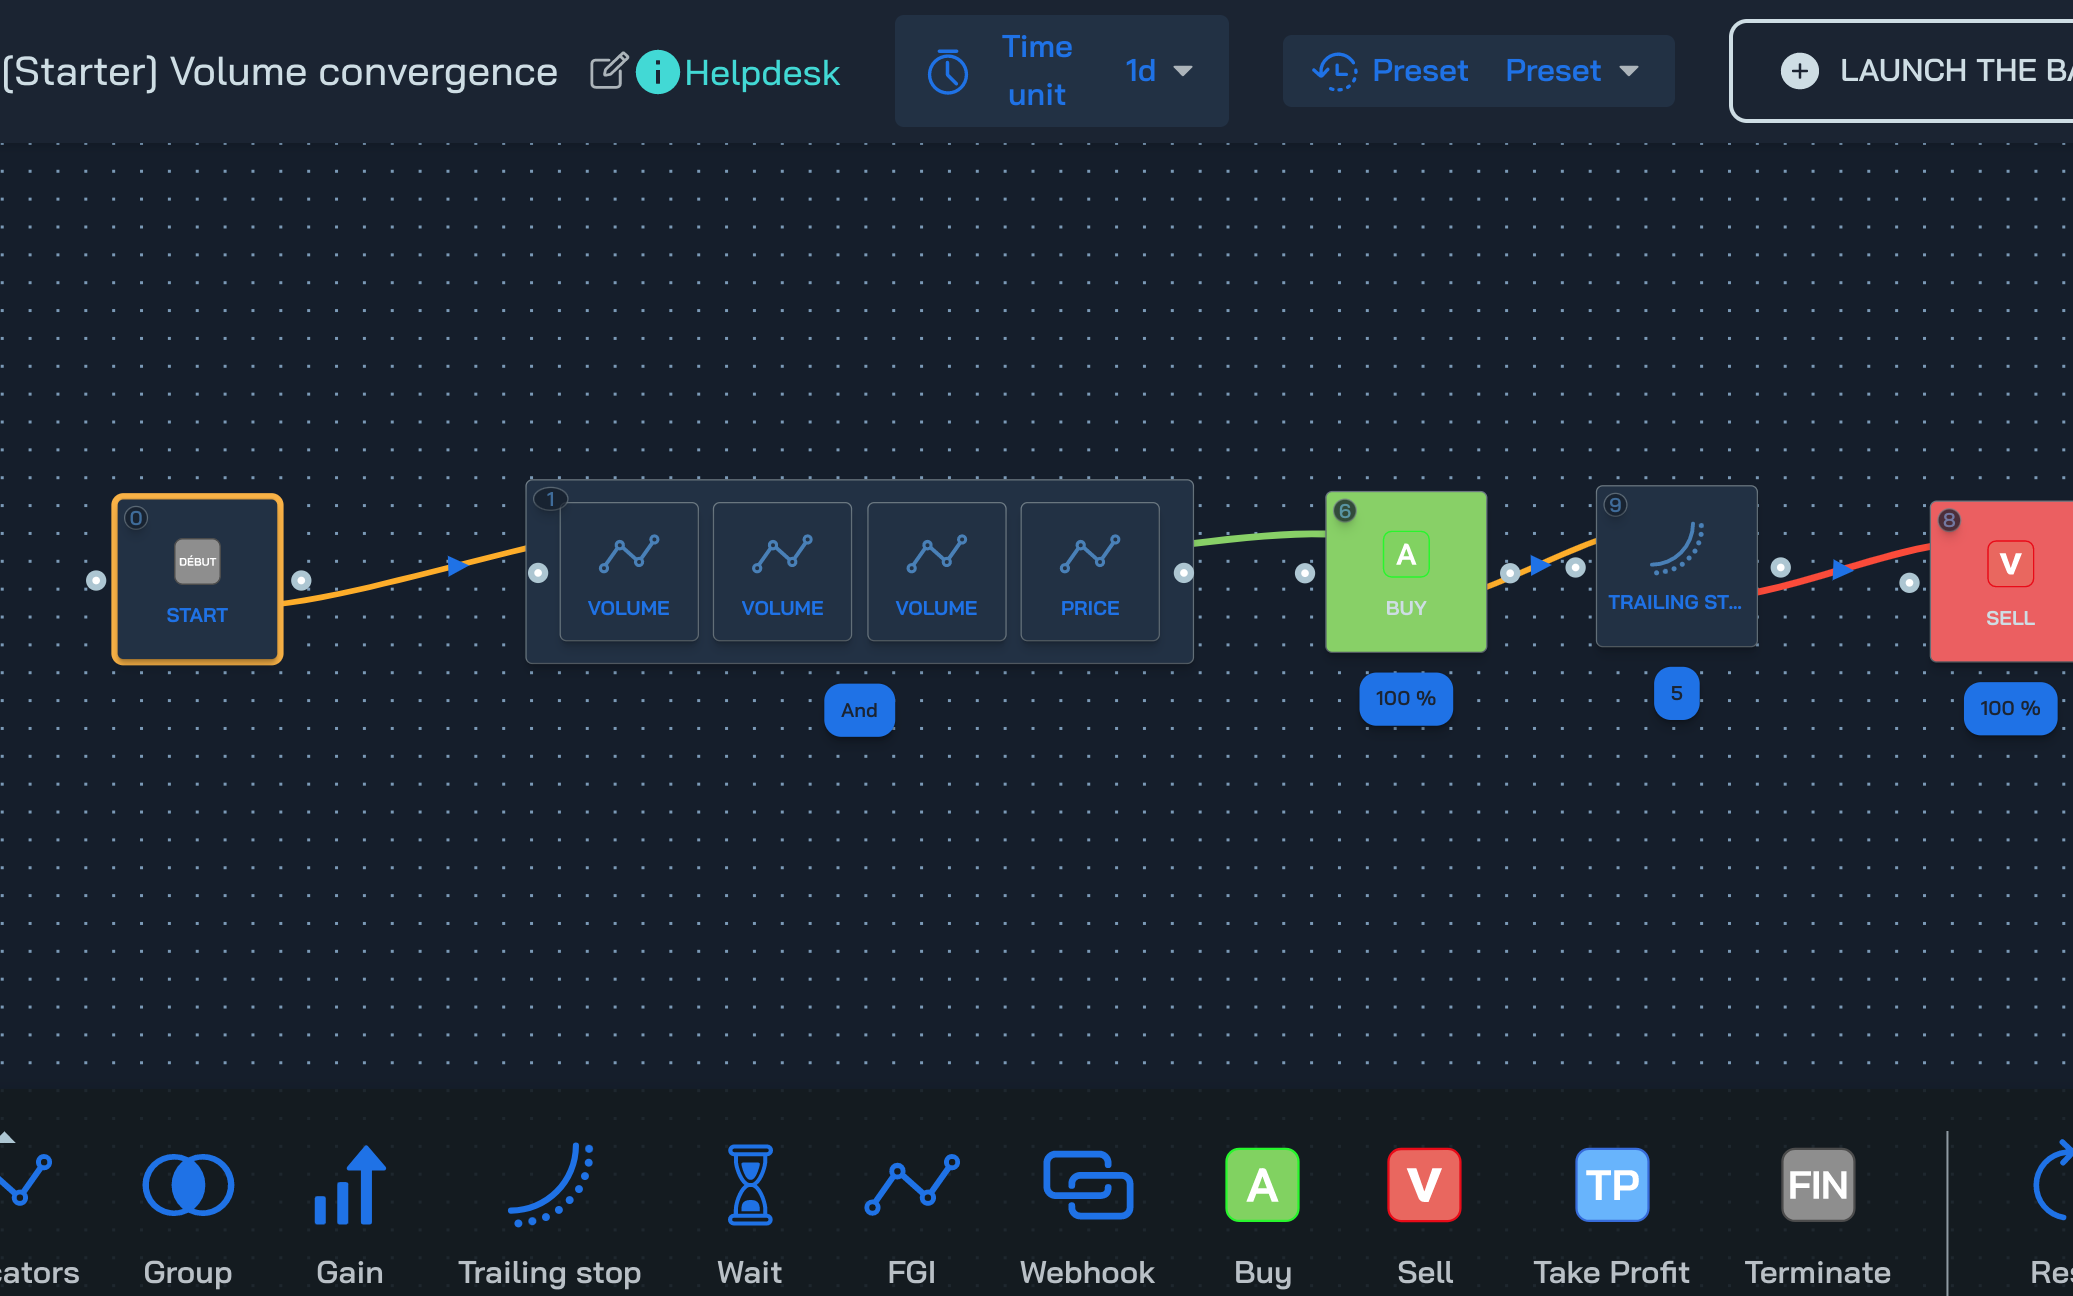
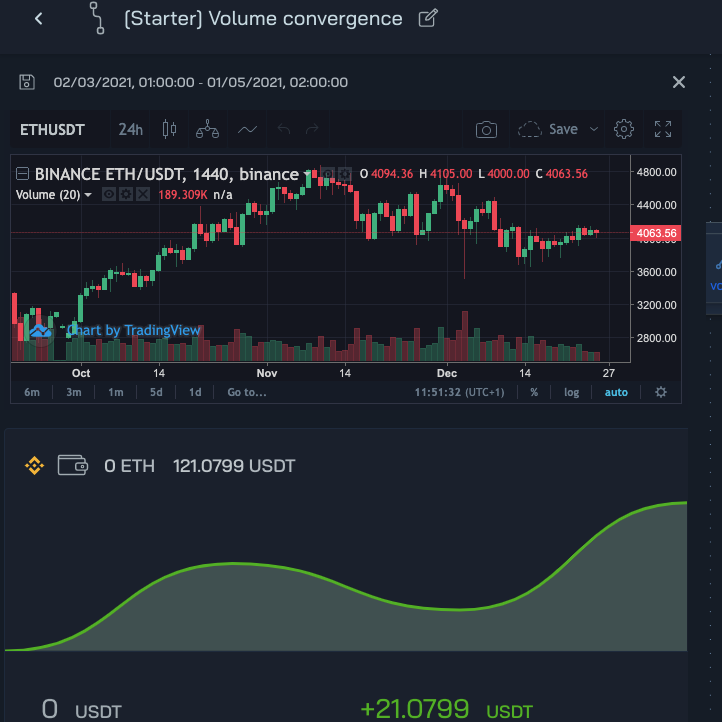
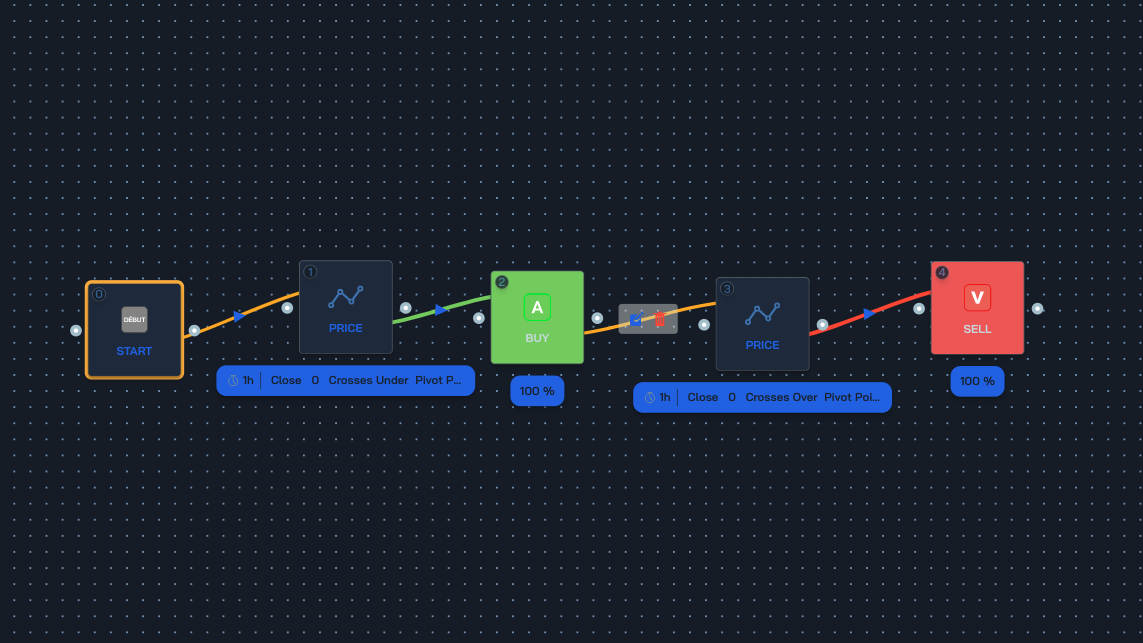
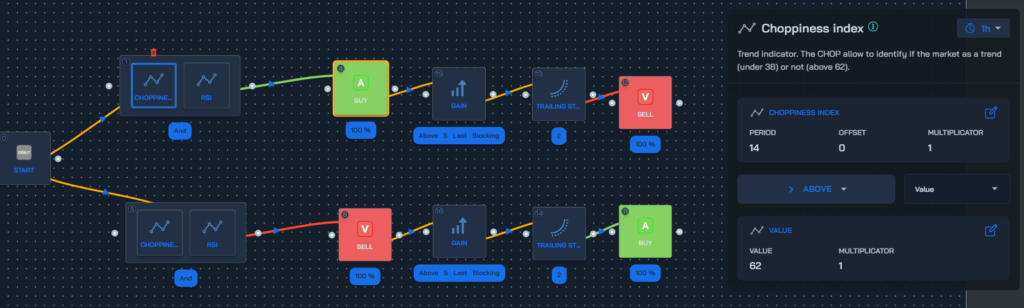
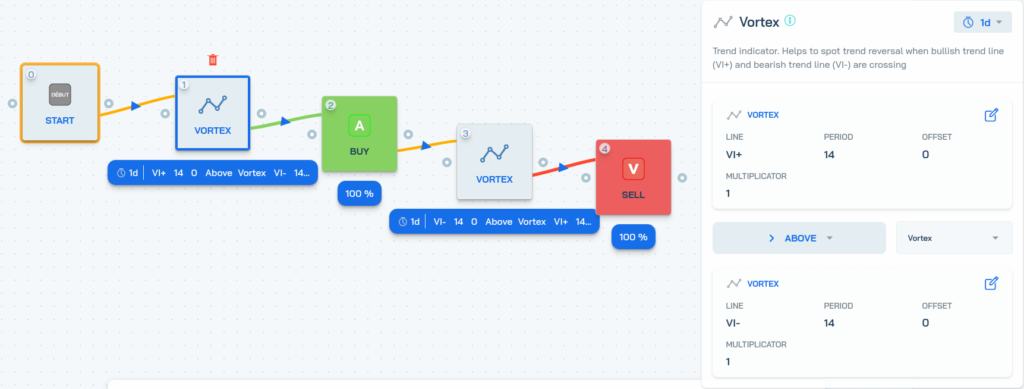
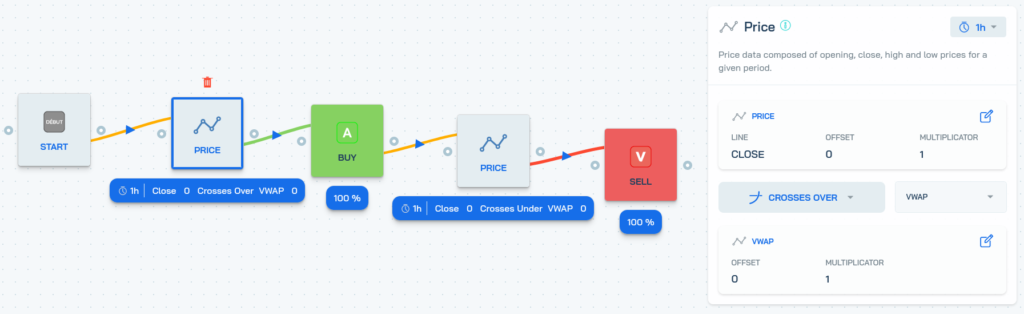
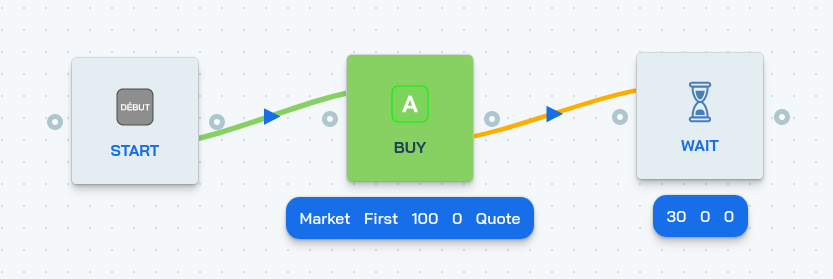
Bot trading with FGI
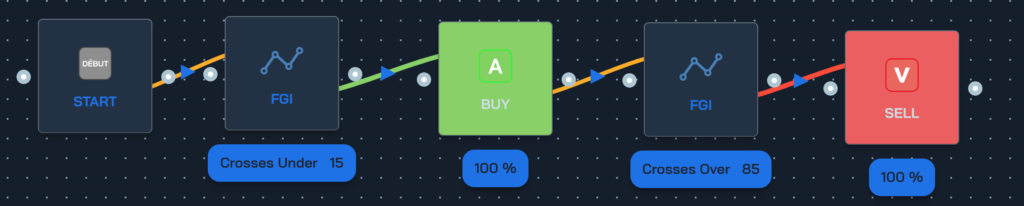
The best part is that this demo strategy is available on the store on botcrypto. This means that you can now create a trading robot with this strategy!
Complete tutorial on fear & greed index (FGI) Read More »