The Vortex is a very useful technical indicator for detecting trend reversals. It is easy to use which makes it a good technical indicator when you are a beginner in technical analysis. Unlike moving averages or RSI, it is a very recent indicator since it was invented in 2010 by Etienne Botes and Douglas Siepman. This does not change its effectiveness as you will discover in our examples…
What is the Vortex ?
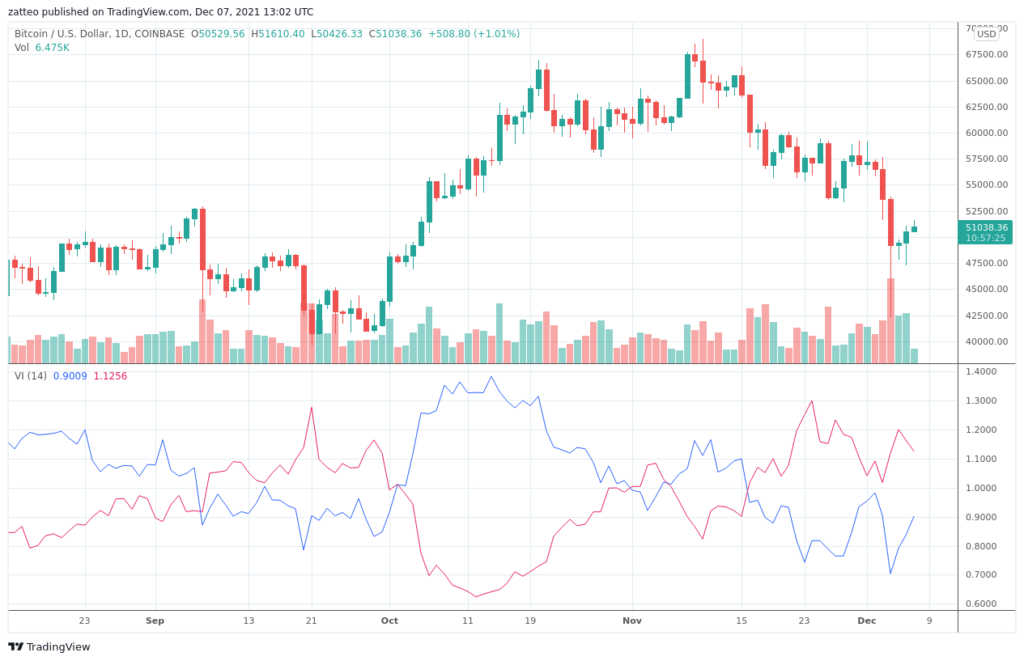
The Vortex consists of two lines that capture positive and negative trends. The VI+ line represents the positive trend (in blue on the graph). The VI- line represents the negative trend (in red on the chart). The higher the value of a line, the stronger the trend it represents.
- If VI+ is above VI-, the trend is upward (it is more positive than negative).
- If VI- is above VI+, the trend is downward (it is more negative than positive).
And the larger the space between the two lines, the stronger the trend.
The Vortex is a general purpose indicator that can be used on all markets (stocks, forex, cryptos, …) and all time units.
How is the Vortex calculated?
The calculation is done with the high price, the low price and the closing price. For a detailed explanation, we refer you to the Vortex indicator on Wikipedia which presents the method we used on botcrypto.
How to use the Vortex ?
The main purpose of the Vortex is to detect changes in trends. So, did you understand how to detect trend changes by reading the previous paragraph? It’s easy and most importantly, it makes sense 😉
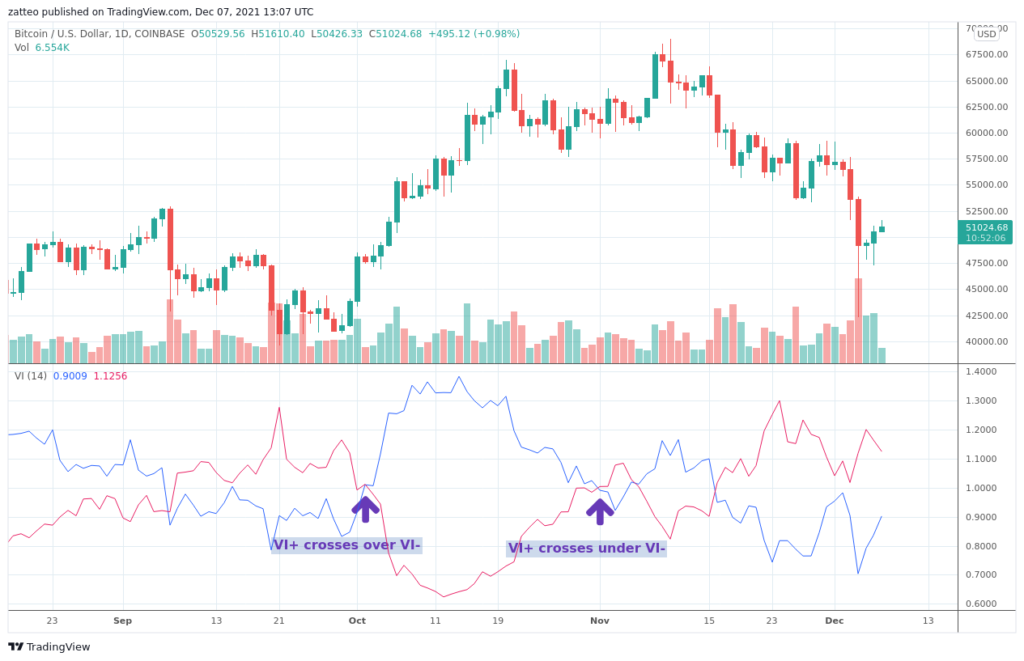
- When the VI+ line, which represents the positive trend (in blue), crosses over the VI- line, which represents the negative trend (in red), the trend goes up. This is a buy signal.
- When the VI+ line representing the positive trend (in blue) passes below the VI- line representing the negative trend (in red), the trend goes down. This is a sell signal.
That’s it! From a practical point of view, traders usually use the Vortex with a period of 14. However, it should be noted that the inventors of this indicator recommend a higher period for small time units. For example, a period of 34 or 55 on typical 5-minute periods.
A trading robot with the Vortex
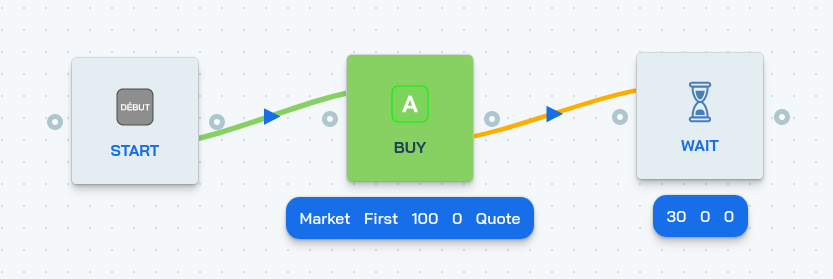
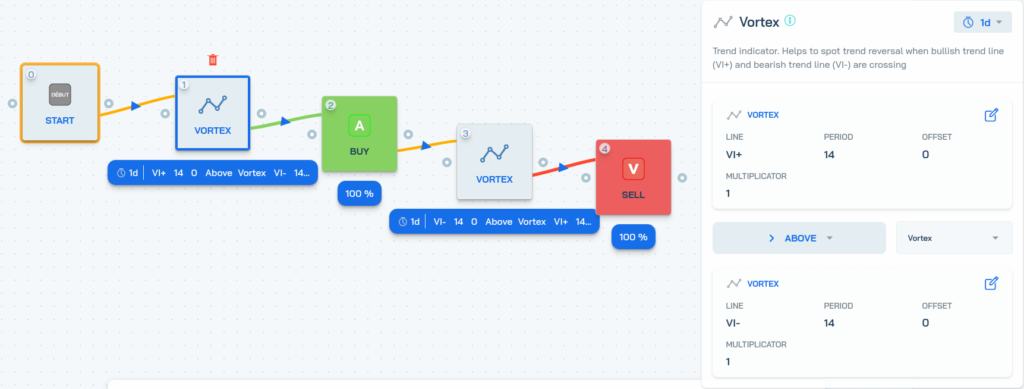
At botcrypto, we don’t see the point of spending our days monitoring the markets. We’d rather enjoy life 😉 So here’s an example of a trading robot built on botcrypto that buys when VI+ crosses VI- up, and sells when VI+ crosses VI- down.
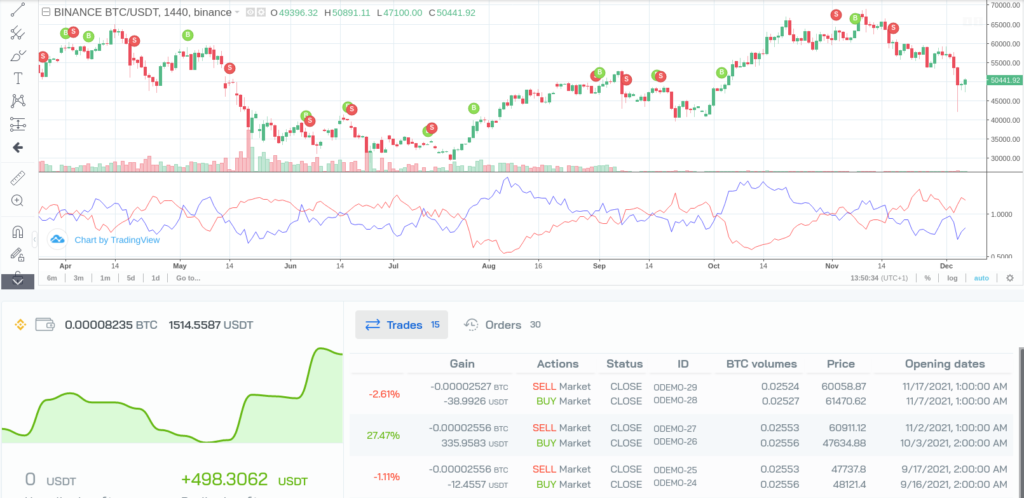
It is a very simple strategy but it already gives very good results! We can see below with a simulation on the year 2021 that there were nice buy and sell signals, for example between August and September and between October and November.
The best part is that the Vortex Cross strategy is available on the store on botcrypto. This means that you can now create a trading robot with this strategy!
A big thanks to Nicocrypto for his contribution to this article. It is to him that you owe the addition of the Vortex on botcrypto!