We are very sad to tell you that Botcrypto will shut down its servers on 30 September 2023. We started this adventure in 2017 and it has been a wonderful journey. But we sadly did not succeed to become a profitable company. You have maybe already seen that there are not been a lot of updates the last two years because we are less and less available for the website. So now is the moment to stop everything before the quality of the service degrades.
Starting of today, you will not be available to take a new subscription. If you are already subscribed, you will be able to use your subscription until the end or until 30 September 2023. All subscription automatic renewals will be canceled.
On 30 September 2023, bots will be stopped, servers will shut down, and you will not be able to access Botcrypto anymore.
If you have any questions or if you want to get your data, feel free to contact us at support@botcrypto.io.
Thank you to everyone who helped us in this journey.
The fear & greed index (FGI) is an indicator that gives the mindset of the crypto market. It is based on many parameters, some of them technicals, some of them socials. It gives insights on when to buy and when to sell.
What is the fear & greed index (FGI) ?
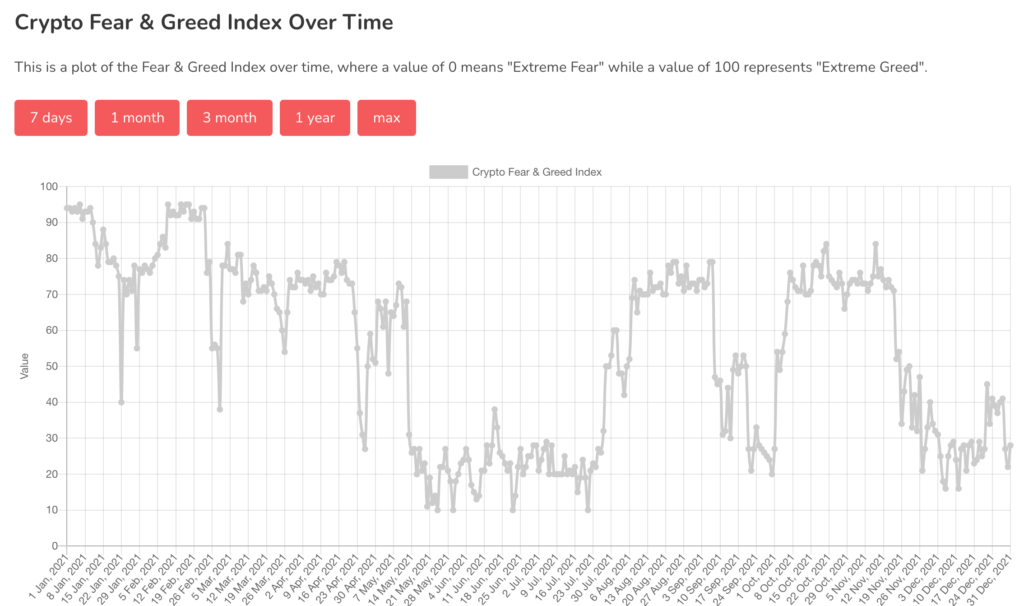
The fear and greed index is an indicator, whose values goes from 0 to 100. When the value goes closer to 0, the market is in fear status. When the values goes closer to 100, the market is in greed status. In other words, when the market is in fear, actors tend to sell their assets while being in FUD (Fear, Uncertainty, Doubt) ; When the market is in greed, actors tend to buy assets while being in FOMO (Fear of Missing Opportunity). You can find the source index here : https://alternative.me/crypto/fear-and-greed-index/ The idea here is to “buy the fear”, meaning that you buy the assets that actors are selling (because of too much loss), then sell them when everybody wants them. As a result, you buy when the price hits its lows, you sell when the price hits its highs. This is a kind of strategy that whales tend to use.
Evolution of FGI through 2021
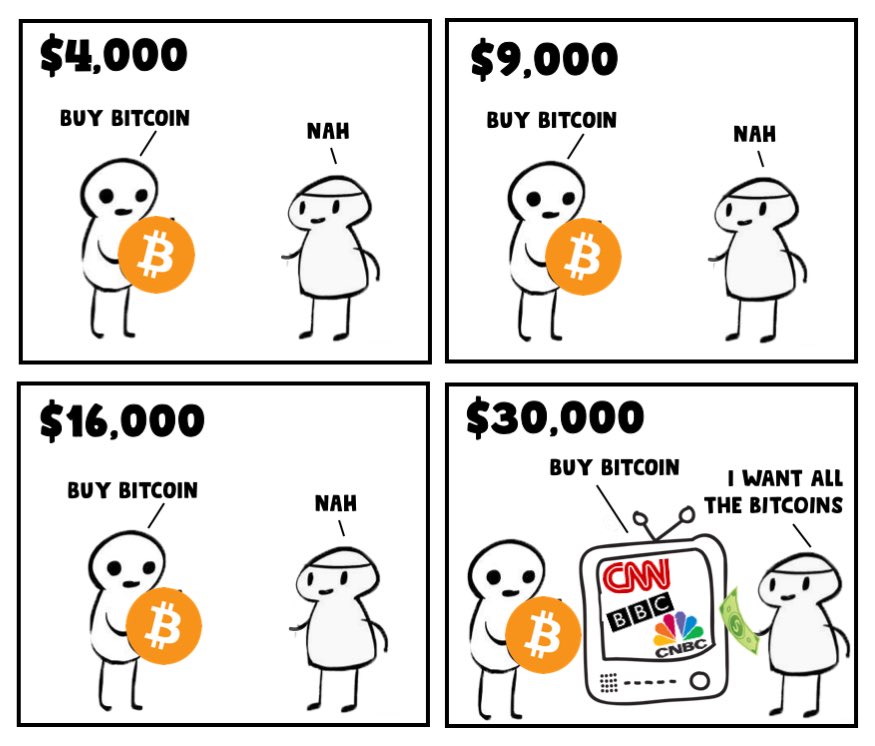
FGI in one picture
How is the fear and greed index calculated ?
Let’s take a look at the five indicators scaled from 0 to 100:
Volatility : the program marks wider fluctuations as a sign of fear
Market volume : once buying volumes increase significantly, the greed levels rise, too
Social media : the client monitors, gathers and counts posts on various hashtags, to see how many interactions they receive over certain time-frames
Dominance : once Bitcoin dominance rises, it indicates an increasing level of greed, and vice versa, when the dominance shrinks, it means that people get scared to invest in BTC.
Trends : the program pulls Google Trends data for various Bitcoin-related search queries and crunches those numbers, especially the change of search volumes
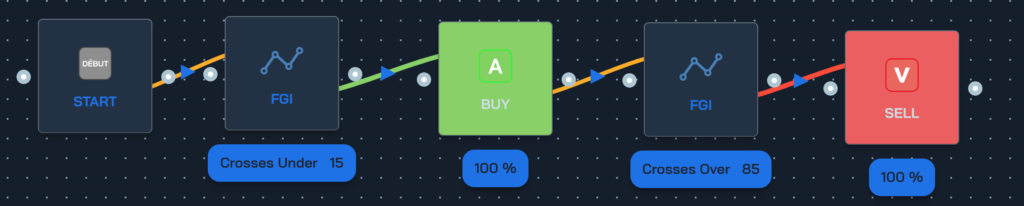
The FGI is to be used preferably on BTC but is still quite relevant on other cryptos as BTC is still the market leader. The strategy here is to buy when FGI is in extreme fear, and sell when FGI is in extreme greed. As the FGI is calculated everyday, it is advised to use a daily strategy. Here is a simple example:
If the FGI goes below 15, buy.
If the FGI goes above 80, sell.
Bot trading with FGI
Strategy example with FGI
The best part is that this demo strategy is available on the store on botcrypto. This means that you can now create a trading robot with this strategy!
The PoP indicator simply applies a condition on a defined couple of candles (last 10th candle and current candle by default) compared to either another couple or a defined percentage between each candle.
How to use the period on period ?
The series can be used based on statistics on percentage of growth or correction.
The series indicator simply applies a condition on one candle (current candle by default) compared to another (previous candle by default).
How to use the series ?
The series can be used based on statistics on bullish and bearish candles. For example, after 4 bullish weekly candles, the 5th weekly candle of BTC is usually bearish.
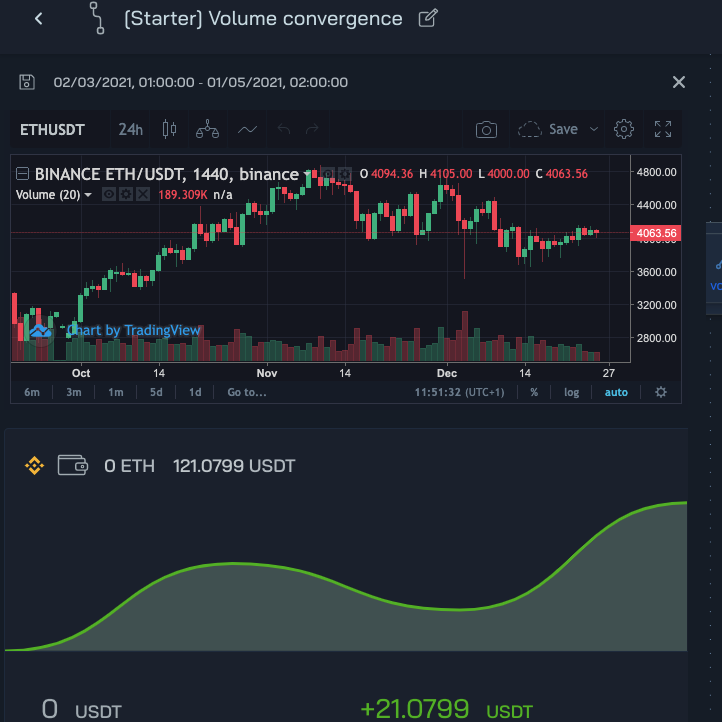
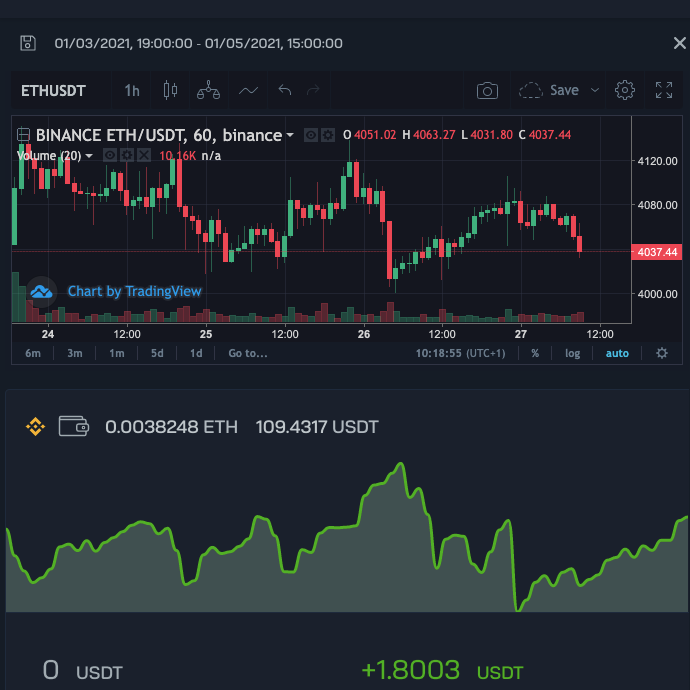
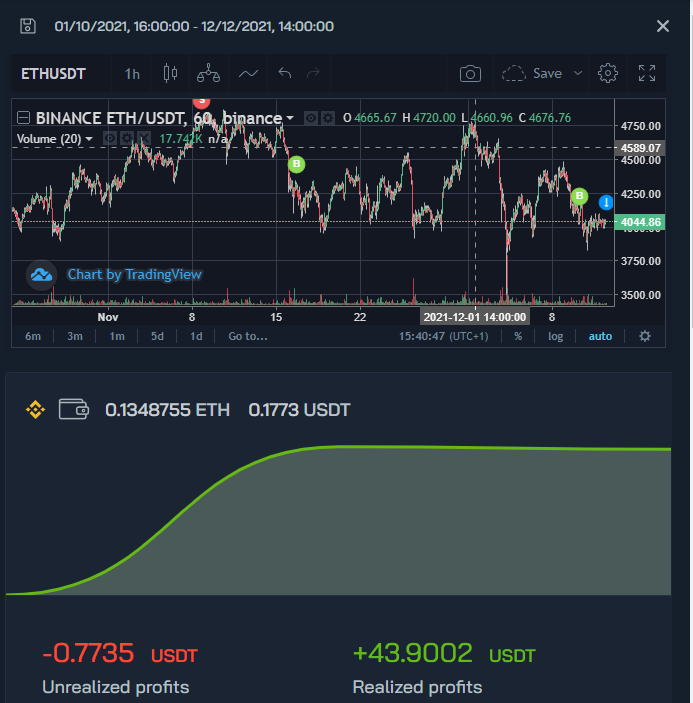
Volume is defined as the sum of the volumes traded over a given period. It is often indicated at the bottom of the graph. It is useful for detecting declines in dynamics, which precede an explosive movement. Also, it is useful for establishing statistics as to the price. A price traded at high volume indicates a great interest on the part of the actors, which reinforces the supports or resistances. Also, the volume allows to show the activity of the Asian, European and American markets, in order to establish which session is the most influential, therefore the session which has the most volatility.
Here is an example of a daily volume on ETHUSDT, the volume gradually reduced, indicating a loss of interest and implying that an explosive move can happen at any time.
How to use volume ?
The main interest of volume is to detect periods of weak & strong activity, by relating the price. Although mainly used as a guide, you can establish a strategy based on the convergences of price versus volume in order to detect changes in direction.
If the volume of the last N candles decreases and the price also decreases, it is likely that a whale will cause a surprise pump. We must therefore position ourselves to purchase.
If the volume of the last N candles decreases and the price also increases, it is likely that the last buyers will place themselves. We must therefore position ourselves in the sale.
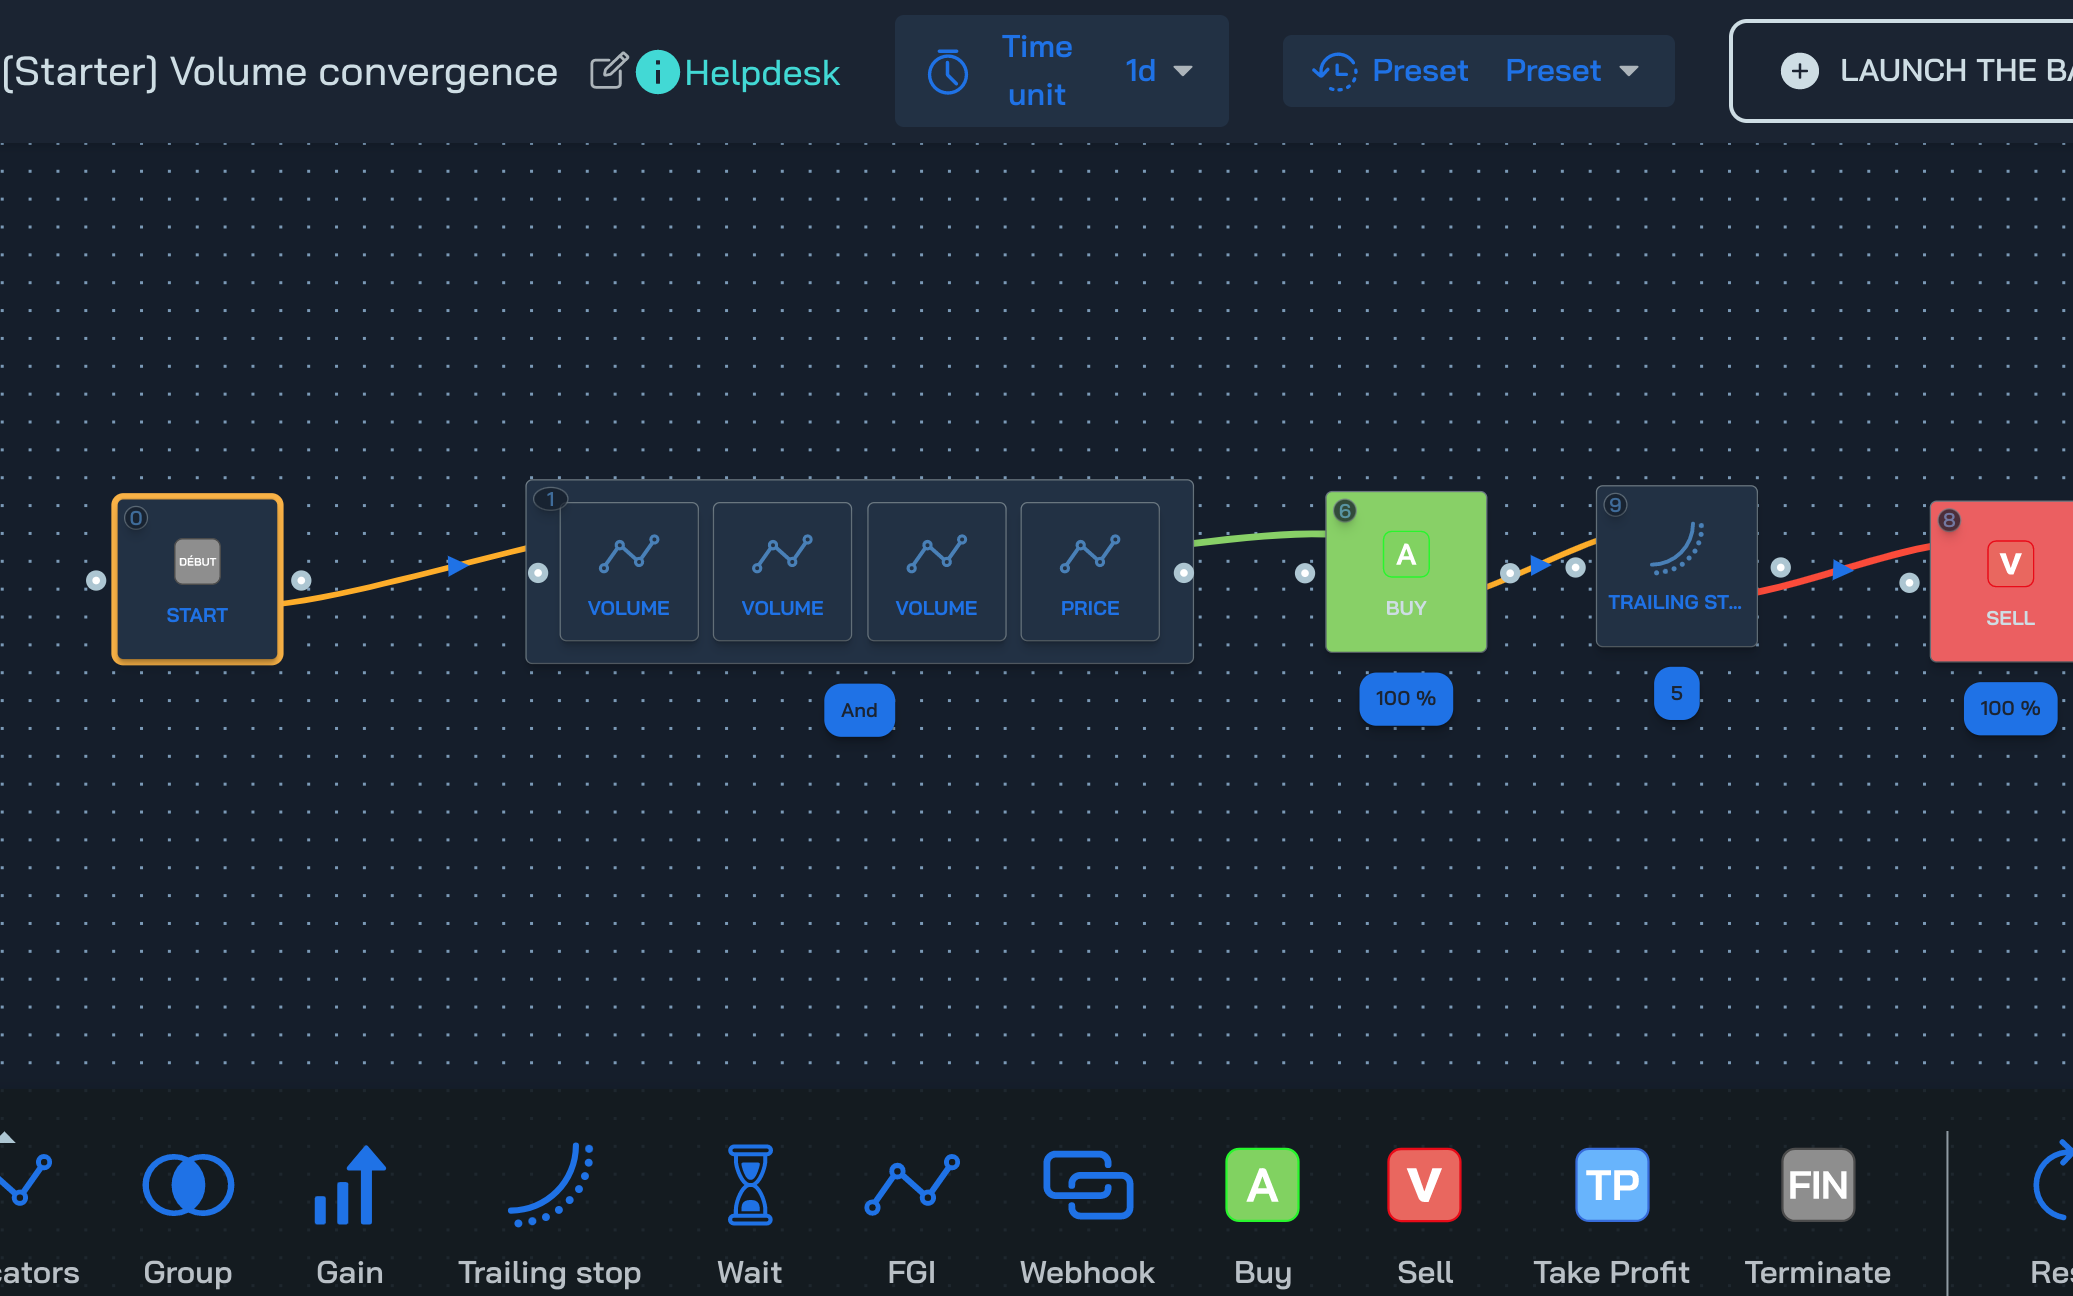
Trading bot with volume, price & convergence
3 conditions on the volume (a candle of smaller volume than the previous one) and a condition on the price (decreasing price) to trigger the purchase
Test results
The best part is that this demo strategy is available on the store on botcrypto. This means that you can now create a trading robot with this strategy!
Pivot points are dynamic prices that define resistance and support relative to a benchmark price. It is easy to use which makes it a good technical indicator when starting out in technical analysis, because the “buy supports and sell resistances” method remains simple and effective. These points are mainly used on the stock market but work just as much on the crypto market.
What are the pivot points ?
Pivot points are dynamic prices that define resistance and support with respect to a reference price, noted point P). The resistances are noted R and the supports S. The closest resistance is R1 then the next one is R2 and so on until R5. The logic is the same for supports. The closer the price gets to a distant support or resistance, the more likely it is to change direction (so you have to take your profits). The advantage of pivot points is that you have a guarantee of profit if you buy support and sell resistance. This is a significant advantage compared to moving averages.
If the price crosses R1 upward, the price is likely to rebound downward. If the price reaches R2, the probability of retracing is even higher.
If the price crosses S1 lower, the price is likely to rebound higher. If the price reaches S2, the probability of retracing is even higher.
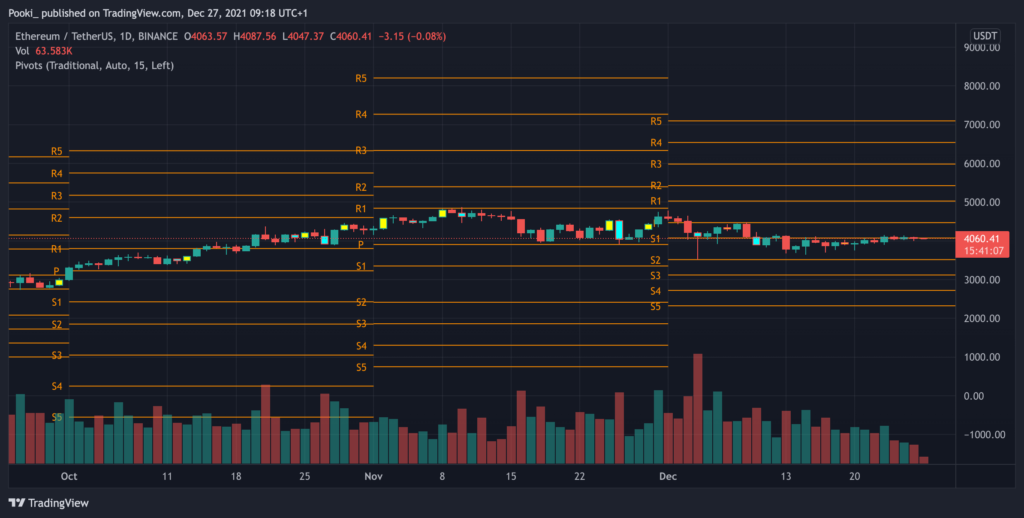
Here is an example of daily pivot points on ETHUSDT, recalculated every first of the month (basic configuration on Trading View)
Comment est-ce que les points pivots sont calculés ?
Pivot point (PP) = (High + Low + Close)/3 R1 = (2xPP) – Low R2 = PP + High – Low R3 = High + 2x(PP-Low) R4 = 3xPP + High – 3xLow
This is only a method of calculation, assuming the candles are OHCL. There are several methods of calculating pivot points, you can find 29 of them on this site: https://www.sierrachart.com/index.php?page=doc/PivotPoints.html
How to use the pivot points ?
The main purpose of points is to stagger one’s buying and selling according to the position of the price. You will find 2 strategies:
Strategy 1: Buy the S1, Sell the R1 The points S1 and R1 are most often reached but offer only limited benefits. It is a simple strategy, with limited risk and advantageous for scalping, the risk of which relates to the management of allocated funds.
If the price hits S1, buy with 100% funds.
If the price hits R1, sell 100% of the position.
Strategy 2: Stagger purchases and sales This strategy consists of removing the risk from the management of funds by dividing the volume of buying and selling according to the level reached. It’s a bit more complex to set up but your entry points and average exit points are more optimized and your profits better. It is a more effective strategy when the price is more volatile. NB: You can combine this strategy with momentum indicators to take advantage of times of high volatility.
If the price hits S1, buy with 50% of the funds. If the price hits S2, buy with 30% of the funds. If the price hits S3, buy with 20% of the funds.
If the price hits R1, sell the first trade. If the price reaches R2, sell the 2nd trade. If the price reaches R3, sell the 3rd trade NB: To limit the risk, I can add a condition asking to close all trades if the price goes from R2 to R1.
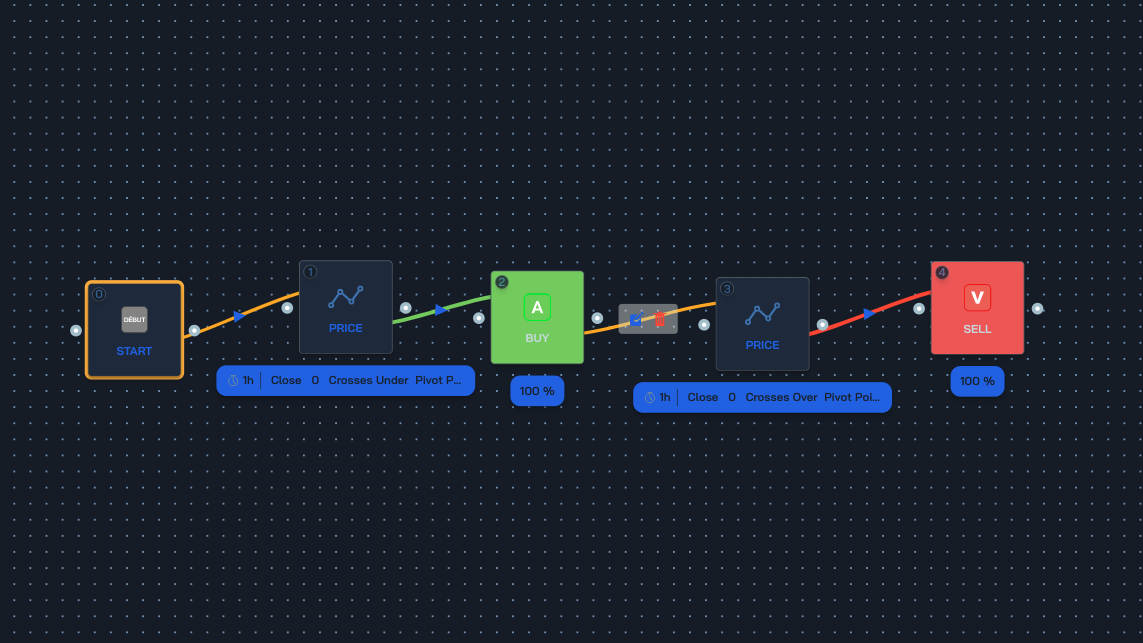
Bot trading with pivot points, 2 strategies
Strategie 1
Strategie 1 results
The best part is that this demo strategy is available on the store on botcrypto. This means that you can now create a trading robot with this strategy!
The Choppiness Index (also called Chop index) is a reliable indicator for detecting trends & consolidation phases. It is easy to use which makes it a good technical indicator when you are a beginner in technical analysis. The Choppiness Index was created by Australian commodity trader E.W. Dreiss, based on the chaos theory (i.e. the price action is not related to any model and cannot be predicted). This is a useful indicator that helps you to allocate your funds at the right time.
What is the Chop Index ?
The Chop consists of one line that evoles in a defined range. When the Chop value is above the range, it means that the price finished its consolidation and the price will start a new trends, regardless of its direction (meaning that it can be an uptrend or a downtrend). When the Chop value is below the range, it means that the price finished its trend and will start its consolidation.
If the chop index value is above 62, the price is ready to start a trend.
If the chop index value is below 38, the price is ready to consolidate.
And the more extreme the value is, the sooner the price will enter into the phase. Think of it like an energy level of the price movement.
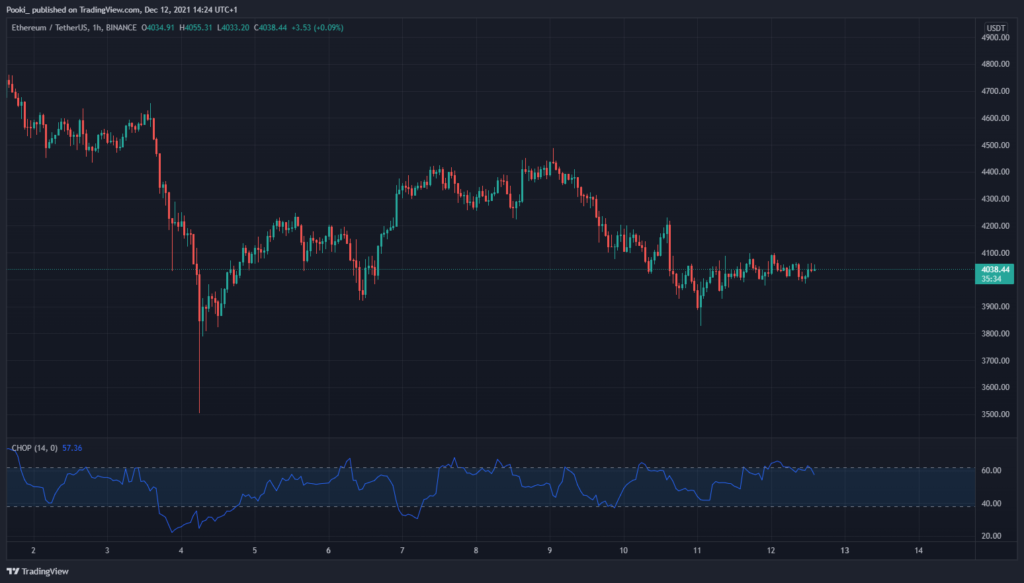
Here is what the chop index looks like.
How is the Chop Index calculated?
Sum True Range for the past n periods. Divide by the result of the following two steps: Calculate the lowest TrueLow for n periods. Subtract from the highest TrueHigh for n periods. Calculate Log10 of the result then Multiply by 100. Divide the result by Log10 of n.
The main purpose of the Chop Index is to detect movements. So, the main use is to open an order when the trend is about to start and to close the order when the trend is about to consolidate.
When the Chop Index is above 62,. This is a open order signal.
When the Chop Index is below 38. This is a close order signal.
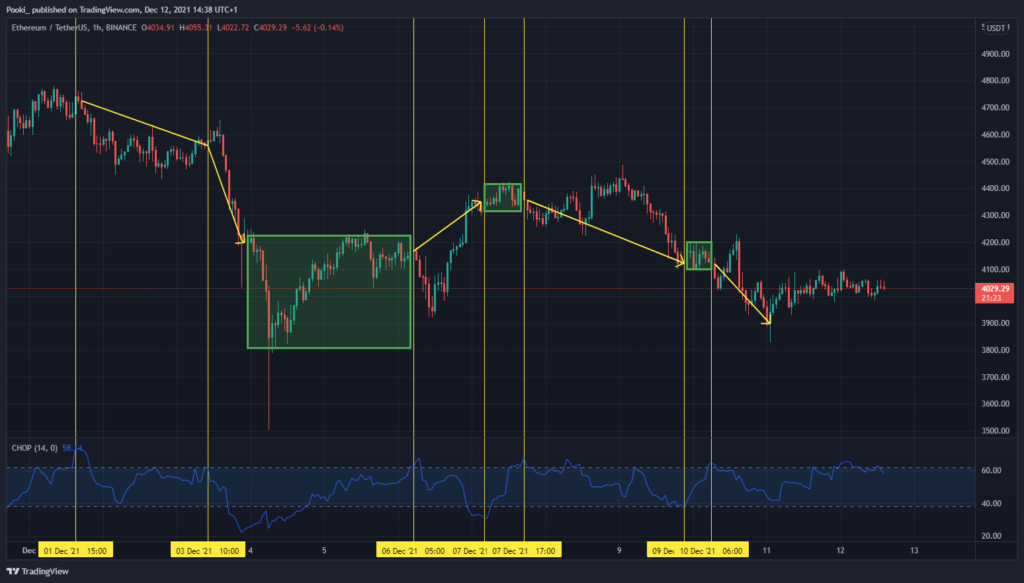
Yellow arrows show trends, green boxes show consolidation. Example on ETH/USDT on Binance in 1H.
The strategy of incorporating the Chop Index can be used in 1H for intraday but can be more reliable on higher periods : 1D and 1W. It doesn’t tell you in which direction the price will go, but the momentum. Do not forget to mix it with trend indicators : RSI, Vortex, …
A trading bot with the Chop Index
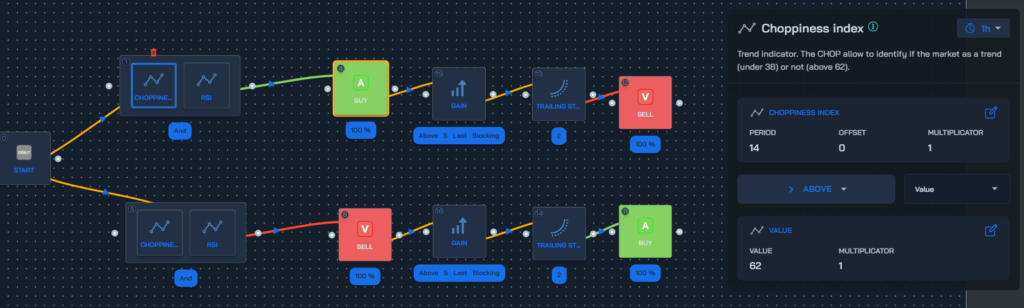
Example of strategy with Chop Index.
Test results with the Choppiness condition.
The best part is that this demostrategy is available on the store on botcrypto. This means that you can now create a trading robot with this strategy!
The Vortex is a very useful technical indicator for detecting trend reversals. It is easy to use which makes it a good technical indicator when you are a beginner in technical analysis. Unlike moving averages or RSI, it is a very recent indicator since it was invented in 2010 by Etienne Botes and Douglas Siepman. This does not change its effectiveness as you will discover in our examples…
What is the Vortex ?
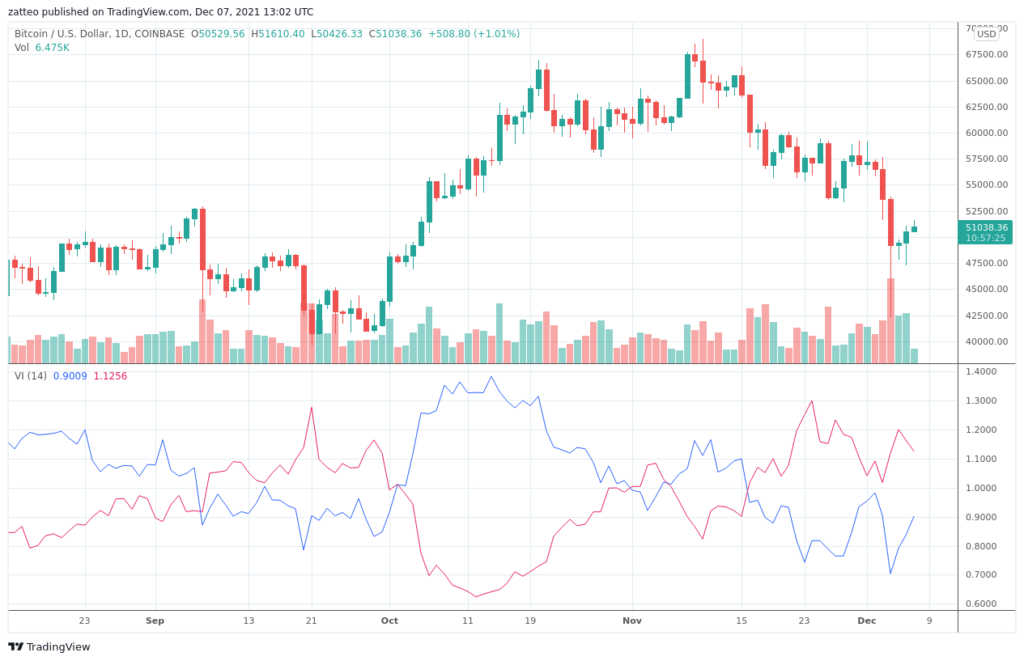
The Vortex consists of two lines that capture positive and negative trends. The VI+ line represents the positive trend (in blue on the graph). The VI- line represents the negative trend (in red on the chart). The higher the value of a line, the stronger the trend it represents.
If VI+ is above VI-, the trend is upward (it is more positive than negative).
If VI- is above VI+, the trend is downward (it is more negative than positive).
And the larger the space between the two lines, the stronger the trend.
Between October and November, we see that VI+ is strongly above VI-. The trend is strongly upward.
The Vortex is a general purpose indicator that can be used on all markets (stocks, forex, cryptos, …) and all time units.
How is the Vortex calculated?
The calculation is done with the high price, the low price and the closing price. For a detailed explanation, we refer you to the Vortex indicator on Wikipedia which presents the method we used on botcrypto.
How to use the Vortex ?
The main purpose of the Vortex is to detect changes in trends. So, did you understand how to detect trend changes by reading the previous paragraph? It’s easy and most importantly, it makes sense 😉
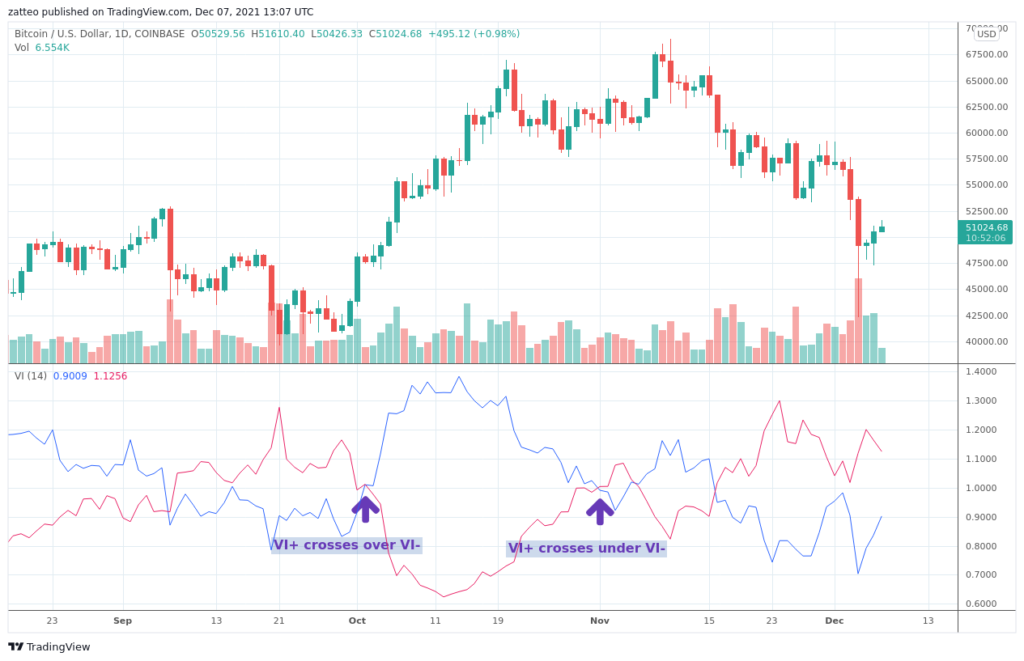
When the VI+ line, which represents the positive trend (in blue), crosses over the VI- line, which represents the negative trend (in red), the trend goes up. This is a buy signal.
When the VI+ line representing the positive trend (in blue) passes below the VI- line representing the negative trend (in red), the trend goes down. This is a sell signal.
Buy and sell signals with the Vortex on a bitcoin chart
That’s it! From a practical point of view, traders usually use the Vortex with a period of 14. However, it should be noted that the inventors of this indicator recommend a higher period for small time units. For example, a period of 34 or 55 on typical 5-minute periods.
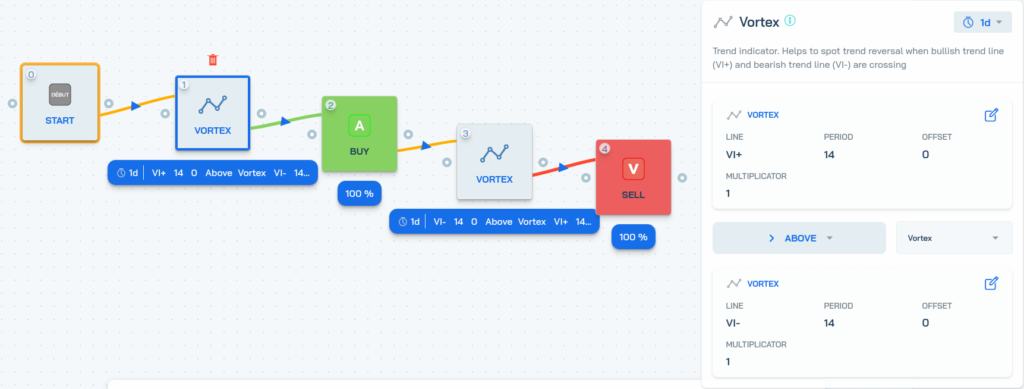
A trading robot with the Vortex
At botcrypto, we don’t see the point of spending our days monitoring the markets. We’d rather enjoy life 😉 So here’s an example of a trading robot built on botcrypto that buys when VI+ crosses VI- up, and sells when VI+ crosses VI- down.
The Vortex Cross strategy on botcrypto.
It is a very simple strategy but it already gives very good results! We can see below with a simulation on the year 2021 that there were nice buy and sell signals, for example between August and September and between October and November.
The result of a backtest with the Vortex Cross strategy on botcrypto.
The best part is that the Vortex Cross strategy is available on the store on botcrypto. This means that you can now create a trading robot with this strategy!
If you are looking to determine the trend of the day to improve your positions and your results, the VWAP (Volume-Weighted Average Price) is the ideal technical indicator. Let’s go for a complete overview of this indicator, including the different ways to interpret it and an application with trading robots!
What is the VWAP (Volume-Weighted Average Price) ?
VWAP stands for Volume-Weighted Average Price. What does this mean? When you calculate an average (e.g. a moving average), all prices are taken into account in the same way. Conversely, VWAP gives more weight to prices that had a lot of volume and less weight to prices that had little volume. It thus gives a more accurate picture of what happened.
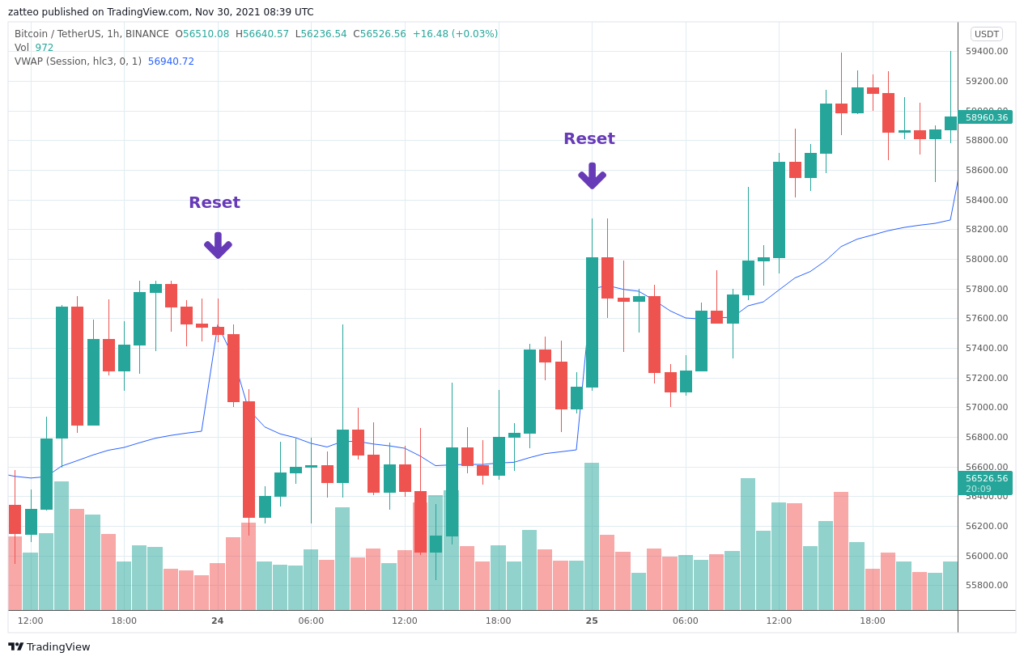
On a graph, the VWAP corresponds to a line that is added next to the prices. It is important to know that the VWAP is calculated according to a period and that it is reset at the beginning of each period. In general, it is used for a period of one day. This is why we see on the graph below the sudden movements of the indicator at the beginning of each day. It resets itself.
Resets are visible at the beginning of each day.
The VWAP indicator is very useful for determining the direction of the trend during the day. It will quickly move above or below the prices and thus indicate the direction of the trend. If there is no trend, it will be a flat line very close to the price.
It is also worth noting that the VWAP lags behind the prices. A delay that increases from hour to hour due to its construction which integrates in the calculation all the volume data since the opening of the day. It is nonetheless interesting precisely because it integrates price and volume.
How is the VWAP calculated?
The VWAP is available on most trading platforms like TradingView from which we have taken the formula below.
1. We calculate the Typical Price of the period.
(High + Low + Close) / 3
2. We multiply the Typical Price by the volume.
(Typical Price x Volume)
3. We add up all the Typical Prices.
Sum(Typical Price x Volume)
4. We add up all the volumes.
Sum(Volume)
5. We divide the two previous results.
VWAP = Sum(Typical Price x Volume) / Sum(Volume)
How to use the VWAP ?
The VWAP is mainly used to give the trend of the day:
When the price is above the VWAP, the trend is up.
When the price is below the VWAP, the trend is down.
It can also be used togive buy and sell signals:
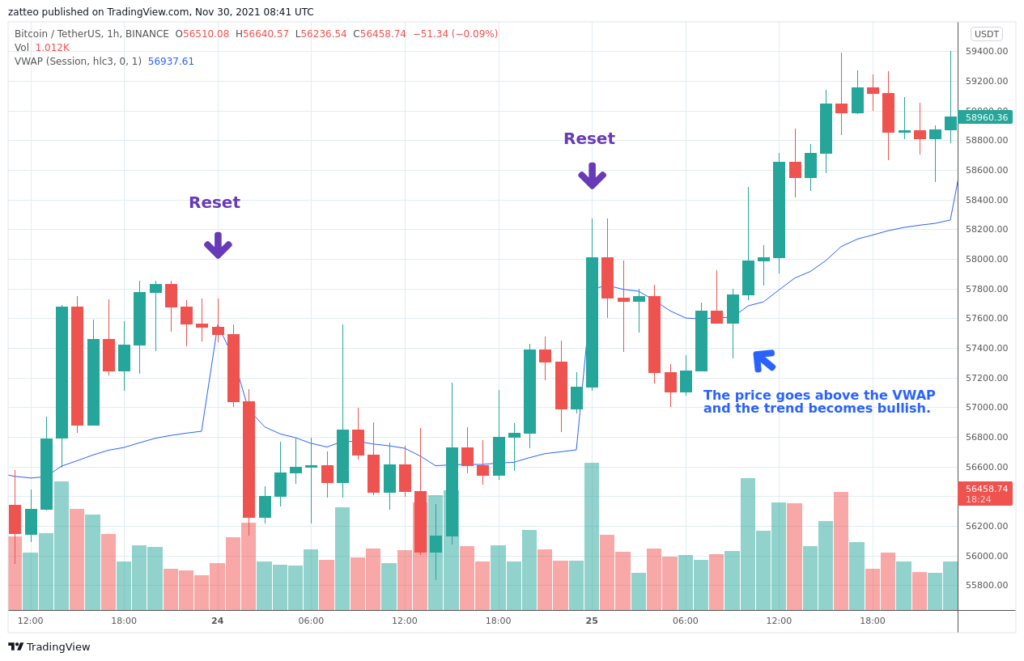
When the price crosses the VWAP, it is a buy signal (the trend becomes bullish).
When the price crosses the VWAP, it is a sell signal (the trend becomes bearish).
An upward cross in the VWAP indicator.
Finally, it can take on the role of support and resistance.
A trading robot with the VWAP
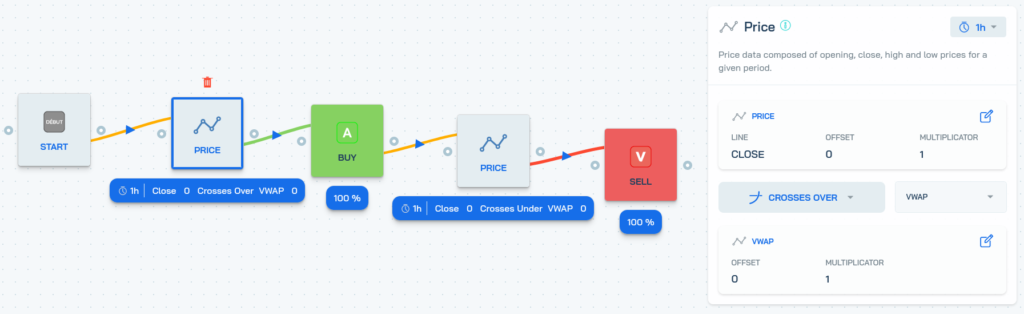
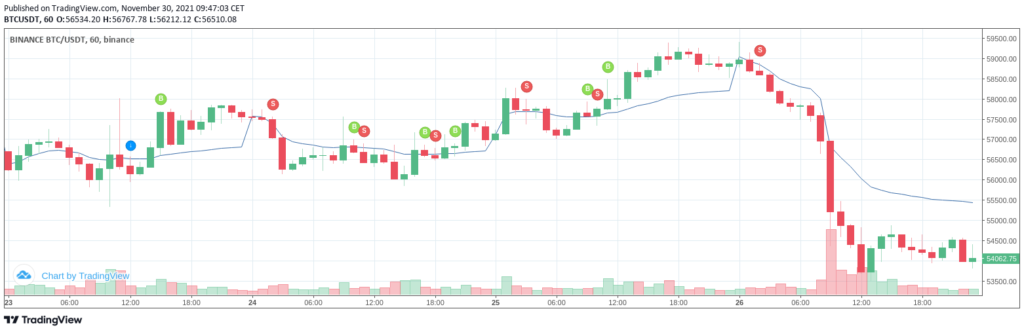
Why monitor charts and technical indicators yourself? One can build on the previous information to build a cryptocurrency trading robot with the VWAP. The VWAP Cross strategy below buys bitcoins when the VWAP crosses the price up (when the trend becomes bullish), and sells bitcoins when the VWAP crosses the price down (when the trend becomes bearish).
The VWAP Cross strategy on botcrypto.
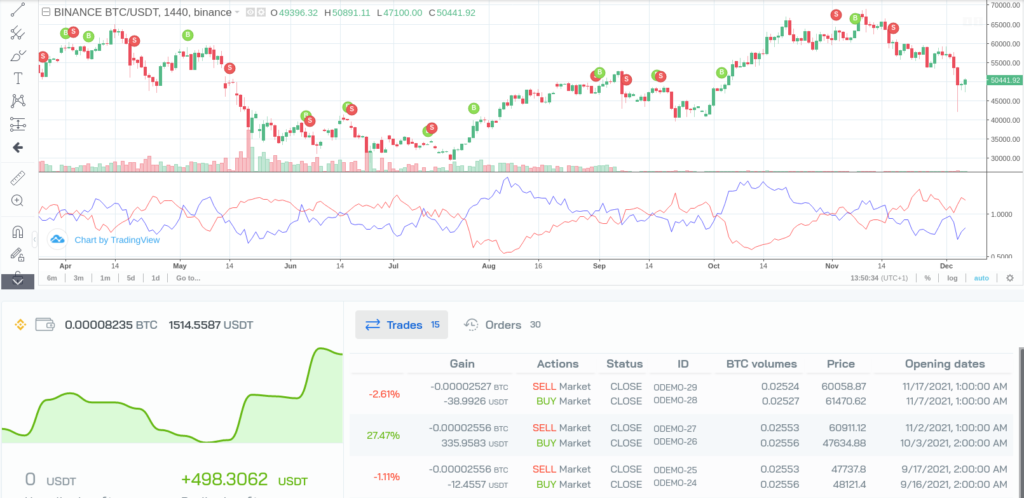
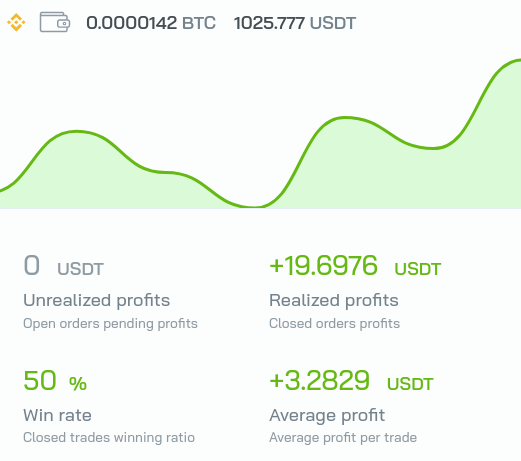
We can see on the results of the backtest below the different orders that have been taken.
The result of a backtest with the VWAP Cross strategy on botcrypto.
The result is quite interesting since there is a profit of almost 20 USDT with an initial investment of 1000 USDT! But maybe the easiest way is to see for yourself? You can try the VWAP Cross strategy for free on botcrypto. You can even copy it to improve it and create your own trading strategies with VWAP.
Now you know everything you need to know about using the VWAP. If you want to dig deeper into how this indicator works, CMartel94’s commentary is full of additional videos. Many thanks to him. And feel free to share your tips for the community in comments!
We are very pleased to announce the launch of a new bitcoin and cryptocurrency trading contest, the Back 2 School Trading Contest. This is the perfect opportunity for all traders to get back on the markets after the holidays, to progress in a friendly atmosphere and above all to try to win the 1000 USDT that we are putting at stake! More details below.
Rules
Your goal? To make the biggest profit in 1 week with 2 BTC. You will start with 1 virtual wallet of 1 BTC on Kraken and 1 virtual wallet of 1 BTC on Binance to be able to take advantage of the different pairs on these platforms.
All cryptocurrencies pairs available on Botcrypto are allowed.
All cryptocurrencies exchanges available on Botcrypto are allowed.
All strategies are allowed.
Trading bots are allowed.
Manual orders are allowed.
Start date : 09/10/2021 19:00 CET End date : 09/17/2021 19:00 CET
Additional rules can be found on our Helpdesk. Botcrypto reserves the right to change the rules and exclude participants at any time.
Prizes
To reward the best traders, we are offering 1000 USDT which will be distributed among the winners.
1st place 500 USDT
2nd place 300 USDT
3rd place 200 USDT
You read that right. Virtual trading, but real earnings! Are you interested? Then take advantage of the next few days to practice creating trading bots with Botcrypto, and register now for the contest!